UIndy School of Business Accreditation

The University of Indianapolis School of Business is accredited by the Accreditation Council for Business Schools & Programs (ACBSP). The ACBSP accredits schools whose primary focus is teaching. Our accreditation status demonstrates that we have met, and will continue to maintain, standards of business education that promote teaching excellence. In addition, ACBSP-accredited schools follow the core values defined by the Baldrige National Quality Program. Two areas that are important to the School of Business include data of CHEA Student Achievement for each accredited program and overall School of Business measures.
CHEA Student Achievement
The University of Indianapolis School of Business conferred a total of 1,329 undergraduate and graduate degrees from academic year 2019 through 2023. These results are illustrated in the graphs below by undergraduate and graduate levels as well as program majors.
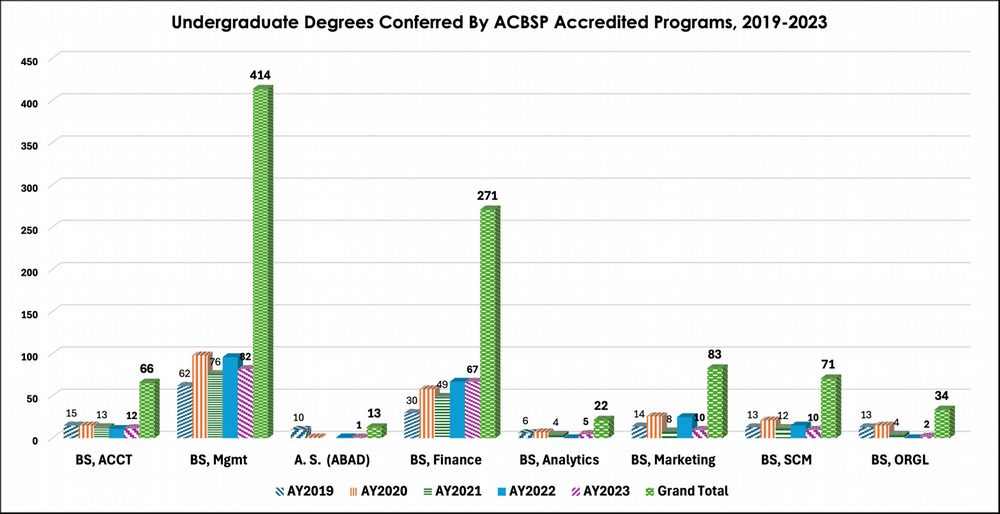
The above graph shows the total of 974 undergraduate degrees conferred from 2019 through 2023. Bachelor of Science in Business Administration and Management major continues to be the most desired undergraduate business major. However, there have been a consistent steady growth in Finance major over the past five (5) years, making the finance major the second highest in the degrees conferred. Click the chart to enlarge it.
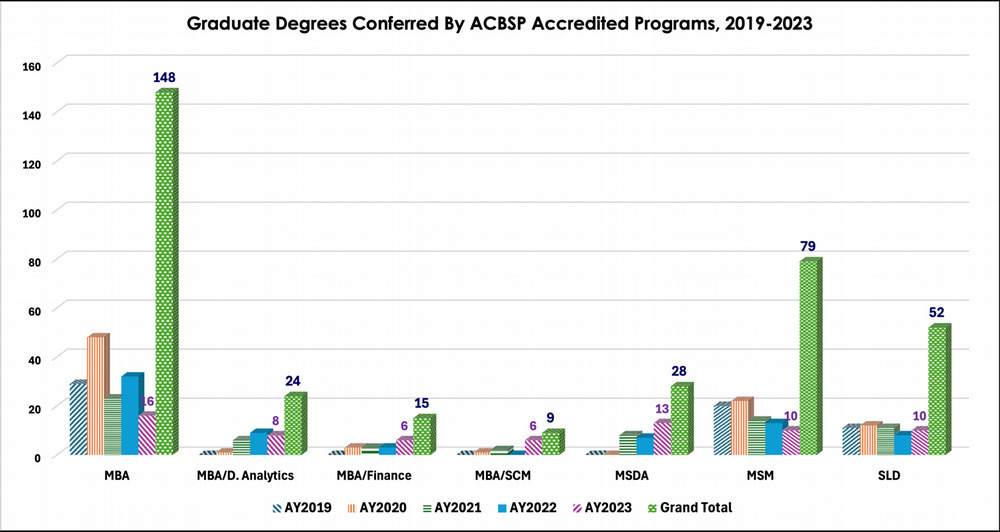
From 2019 through 2023, the University of Indianapolis School of Business conferred 355 graduate degrees. These results are illustrated in the above graph by program major. Click the chart to enlarge it.
Overall School of Business Performance Measures
Two overall outcomes of CHEA Student Achievement for the University of Indianapolis School of Business for ACBSP are retention and graduation percentage rates. The retention rate and graduation percentage rates for the School of Business are shown in the Retention Rate and the
Graduation Rate charts below. The timeline for the graphs for the retention and the graduation rates refers to the time retention and graduation rates were measured.
It should be noted that the School of Business undergraduate programs accept any interested University of Indianapolis student meeting the University's admissions requirements. Some students enroll in an academic program under exploratory circumstances and later change majors,
which affects the retention and graduation rates. The data reflects students whose initial major was listed as Business.
Retention and Graduation Rates
University of Indianapolis School of Business undergraduate retention rates and graduation rates are as follows:
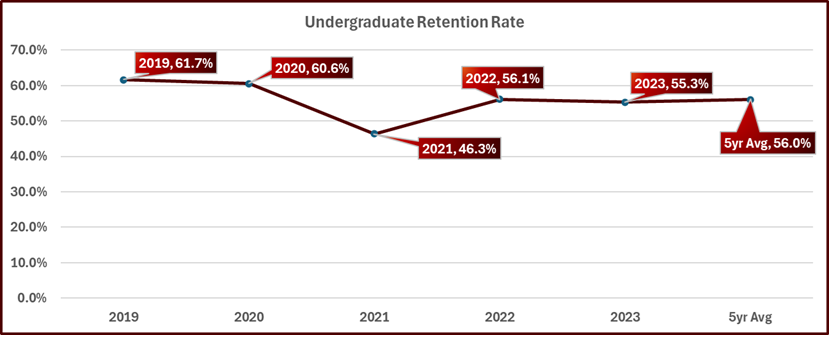
The above graph shows undergraduate retention rates for the years 2019 through 2023. The average is 56.0%, a significant decrease from the 5 years prior, in part due to the low rate recorded in 2021 at the height of the COVID-19 pandemic. Since the fall of 2024, the university has dedicated resources to and funded programs that specifically address this challenge.
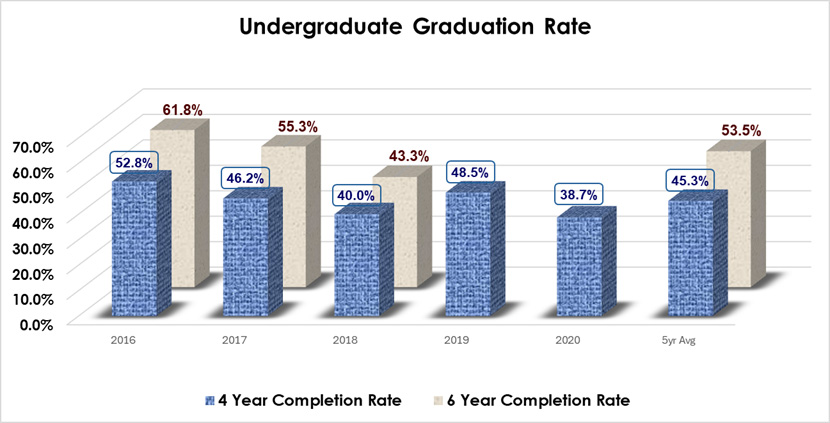
The above graph shows the 4-year and the 6-year graduation rates for 2016 through 2020 and 2016 through 2018 respectively. An average of 45.3% graduated within 4 years, and an average of 53.5% graduated within 6 years.
Students' Results of the School of Business Quality
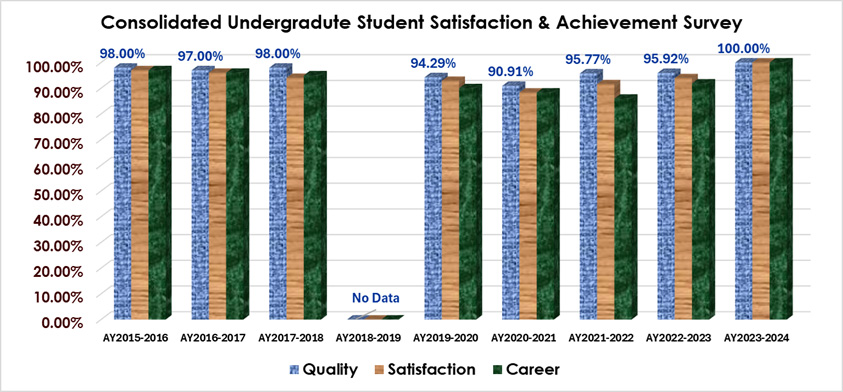
Students in their senior year, from academic year 2015/2016 through 2023/2024 were surveyed on three (3) major education experience factors related to the 1) Quality of Courses Delivered, 2) Satisfaction with the Courses Delivered, and 3) Whether the Business Courses Adequately Prepared them for their Careers.
Results from these three metrics are presented in the graph below. Overall, our baccalaureate graduates have been overwhelmingly satisfied with their UIndy School of Business education.
The above graph shows students from years 2015 through 2024 who, upon completing their undergraduate degree, believed they received a quality education.
Analysis of Results
- Total Data Reporting Period: 2015/2016 – 2023/2024
- Education Quality Average: 96.24%
- Graduate Satisfaction Average: 94.20%
- Career Preparedness Average: 93.01%
- COVID-19 Impact Period: 2019/2020 – 2021/2022
- Education Quality Average: 93.66%
- Graduate Satisfaction Average: 90.91%
- Career Preparedness Average: 88.08%
There was a notable but very minimal impact from the disruptions caused by the global COVID-19 pandemic. The potential negative impact of COVID-19 was significantly mitigated by the School of Business’ agility in its instructional delivery philosophy. Not many colleges can say the same.
Figure 1
Students Course Quality Survey (2015/2016 – 2023/2024)
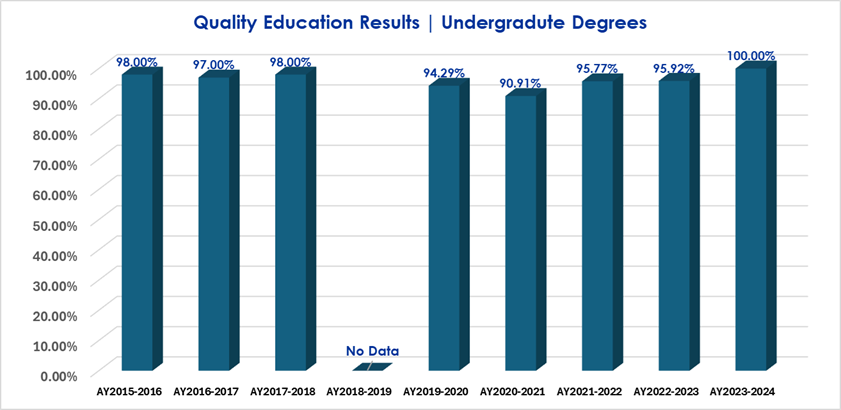
The above graph shows students from year 2015 through 2024 who, upon completing their undergraduate degree, believed they received a quality education. Education Quality Average: 96.24%
Figure 2
Students’ Course Satisfaction Survey (2015/2016 – 2023/2024)
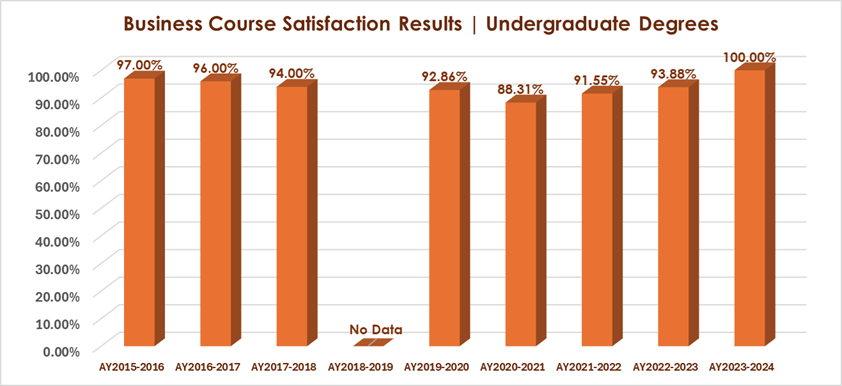
The above graph shows students from year 2015 through 2024 who, upon completing their undergraduate degree, were satisfied with their business courses. Graduate Satisfaction Average: 94.20%
Figure 3
Students’ Career Readiness Survey (2015/2016 – 2023/2024)
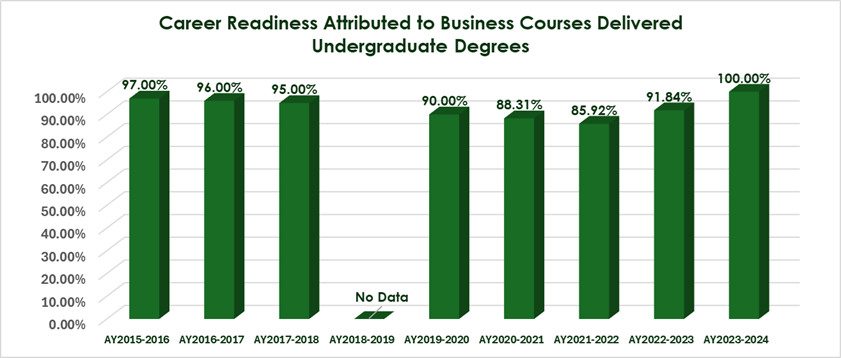
The above graph shows students from year 2015 through 2024 who, upon completing their undergraduate degree, believed their business courses prepared them for their career paths. Career Preparedness Average: 93.01%
Program Goals & Student Learning Outcomes
The University of Indianapolis School of Business, in conjunction with ACBSP, follows the Six Sigma Define, Measure, Analyze, Improve and Control (DMAIC) process for continual improvement of academic programs.
To assure pertinent and current learning outcomes for students completing each program within the School of Business, faculty review the learning outcomes for each academic major. Critical student learning outcomes are identified for each of our business majors, based upon benchmarking against professional society certifications and standards within the field, as well as an environmental scan of employer expectations.
School of Business faculty have identified key outcome assessment measures to verify and confirm that students have achieved the identified program student learning goals. Because some of the learning objectives or assessment methods were changed or modified, based on the annual reviews, there may be some instances in which a program will only be able to report the baseline data for some or all of the program student learning outcomes.
As part of our continual quality improvement process, faculty reflect on assessment of students' learning outcomes to diagnose any opportunities for strengthening the program. Improvements are made, based on the collaboration with other colleagues in the discipline. Adjustments may be made in prior foundation courses, course objectives, course activities, lesson plans for delivery and application of key concepts, and/or design of the assessment instrument.
The following links provide a summary of student learning outcomes and key assessment measures being evaluated over time, as well as the resulting improvements, if any, which have been made or improvements to be implemented or continued in the future.
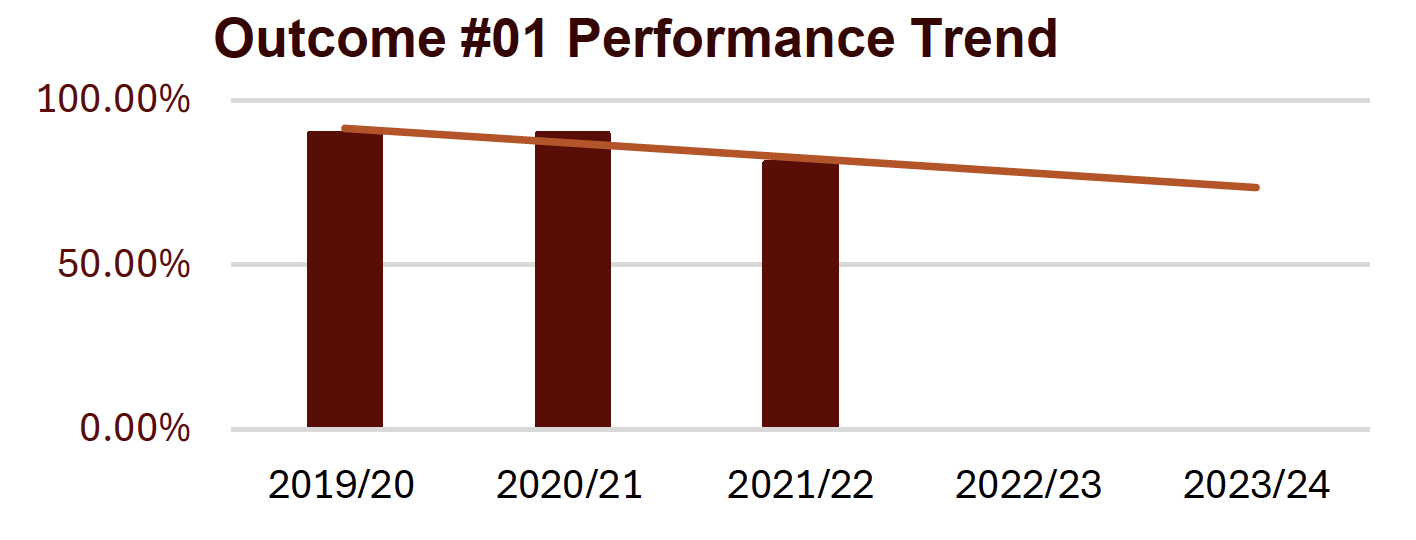
Outcome #1
- Approach (DEFINE): Graduates will demonstrate knowledge of management and leadership theories.
- Deployment (MEASURE) - Direct, Formative, Internal: Seventy-five percent (75%) or better BADM 231- Overall class average score for the Demonstration Presentation
- Results (ANALYZE):
- 2019/20 was 90%
- 2020/21 was 90 %
- 2021/22 was 81%
- 2022/23 No Data
- 2023/24 No Data
- Analysis of Results (INTERPRET/ANALYZE):
- AY2022-2023 Results (N/A) Data unavailable
- AY2023-2024 Results No Data
- Action Taken/Improvement Made (IMPROVE): AY2024-2025 Improvement Plan: Implement strategy to prioritize the scheduling of this assignment to mitigate external factors such as poor attendance
- Graph of Trends (CONTROL)
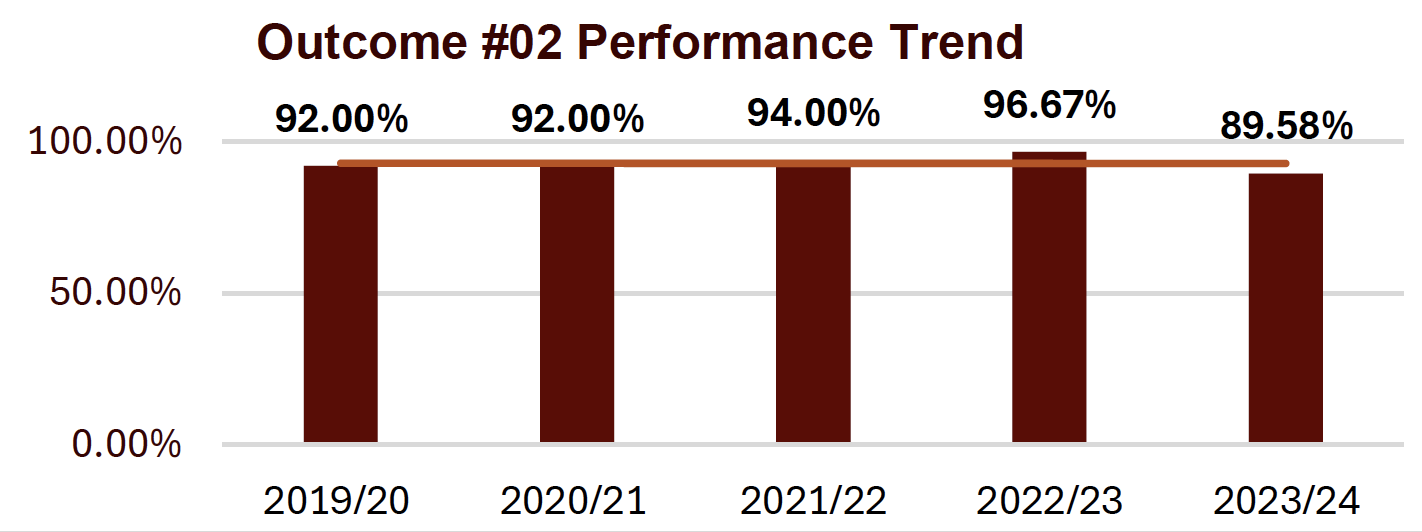
Outcome #2
- Approach (DEFINE): Graduates will demonstrate a basic knowledge of organizational behavior.
- Deployment (MEASURE) - Direct, Formative, Internal: Seventy-five percent (75%) or better MGT 234- Overall class average score of Exam 1
- Results (ANALYZE) - Activity Scores:
- 2019/20 was 92%
- 2020/21 was 92%
- 2021/22 was 94%
- 2022/23 No Data
- 2023/24 No Data
- Analysis of Results (INTERPRET/ANALYZE):
- AY2022-2023 Results Class average score 96.67% (Met)
- AY2023-2024 Results Class average score 89.58%
- Action Taken/Improvement Made (IMPROVE):
- Plan for AY2023-2024: Consider raising the goal.
- AY2024-2025 Improvement Plan: Analyze data pending an increase of the goal.
- Graph of Trends (CONTROL)
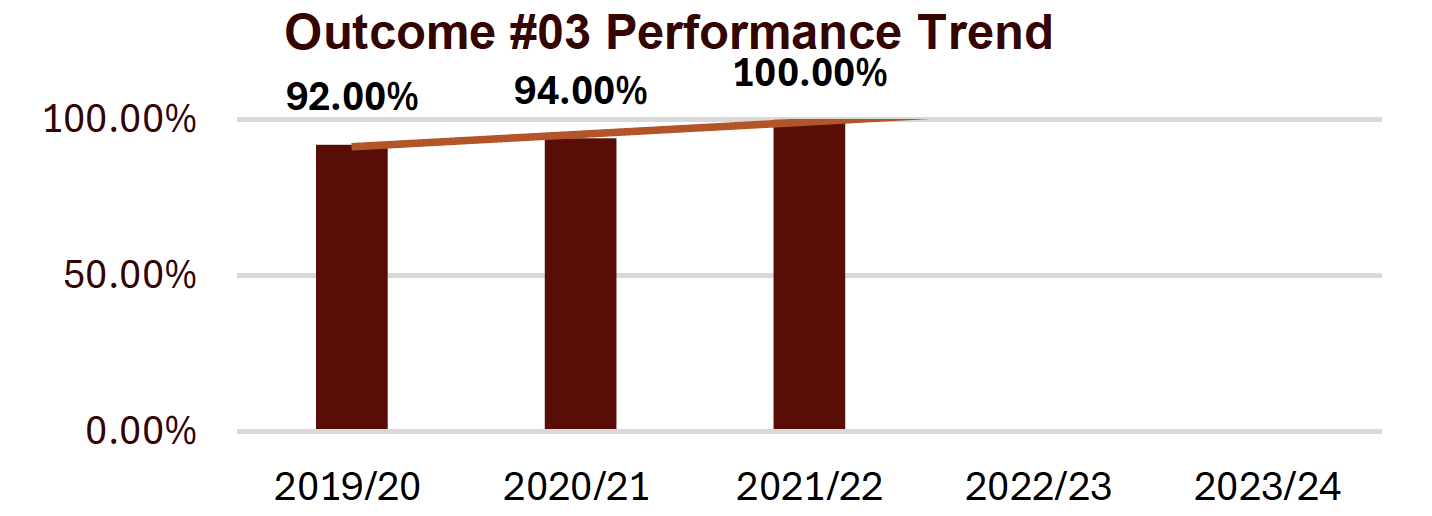
Outcome #3
- Approach (DEFINE): Graduates will recognize and analyze Team development processes.
- Deployment (MEASURE) - Direct, Formative, Internal: Seventy-five percent (75%) or better MGT 234- Overall class average score on 12 Angry Men video assignment
- Results (ANALYZE) - Activity Scores:
- 2019/20 was 92%
- 2020/21 was 94%
- 2021/22 was 100%
- 2022/23 No Data
- 2023/24 No Data
- Analysis of Results (INTERPRET/ANALYZE):
- AY2022-2023 Results Data unavailable (N/A)
- AY2023-2024 Results No Data
- Action Taken/Improvement Made (IMPROVE): AY2024-2025 Improvement Plan: Continue with current strategy due to current student success
- Graph of Trends (CONTROL)
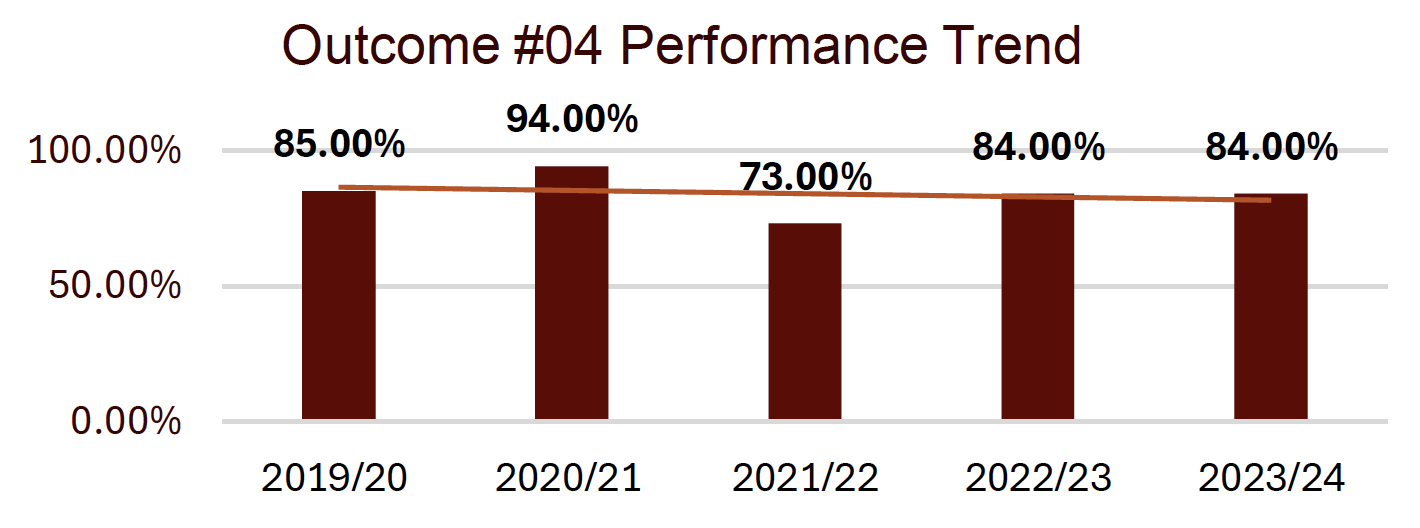
Outcome #4
- Approach (DEFINE): Graduates will demonstrate a basic understanding of Business Communications; Guffey’s 3x3 Writing Process.
- Deployment (MEASURE) - Direct, Formative, Internal: Minimum 75% in BADM 231-Overall class average score of Exam 1.
- Results (ANALYZE) - Activity Scores:
- 2019/20 was 85%
- 2020/21 was 94%
- 2021/22 was 73%
- 2022/23 was 84%
- 2023/24 was 84%
- Analysis of Results (INTERPRET/ANALYZE):
- AY2022-2023 Results Class average score 84% (Not met)
- AY2023-2024 Results Class average score 84%
- Action Taken/Improvement Made (IMPROVE):
- Plan for AY2023-2024: We will examine the test to see if it is in sync with the class material.
- AY2024-2025 Improvement Plan: Class average remains consistent across the identified academic years
- Graph of Trends (CONTROL)
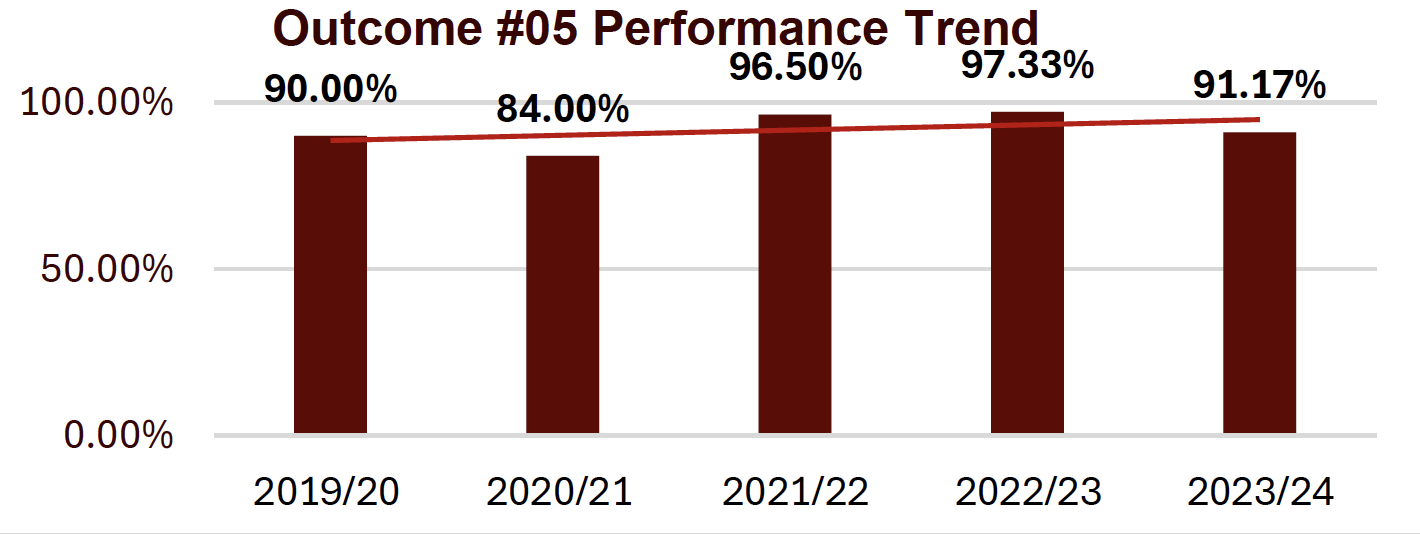
Outcome #5
- Approach (DEFINE): Graduates will demonstrate a basic knowledge of Organizational Behavior theories, including leadership theories.
- Deployment (MEASURE) - Direct, Formative, Internal: Minimum 75% in MGT 234-Overall class average score of Exam 2.
- Results (ANALYZE) - Activity Scores:
- 2019/20 was 90%
- 2020/21 was 84%
- 2021/22 was 96.5%
- 2022/23 was 97.33%
- 2023/24 was 91.17%
- Analysis of Results (INTERPRET/ANALYZE):
- AY2022-2023 Results Class average score 97.33% (Met)
- AY2023-2024 Results Class average score 91.17%
- Action Taken/Improvement Made (IMPROVE):
- Plan for AY2023-2024: All students performed well on this assignment. It is serving its purpose.
- AY2024-2025 Improvement Plan: Continue with current strategy due to current student success
- Graph of Trends (CONTROL)
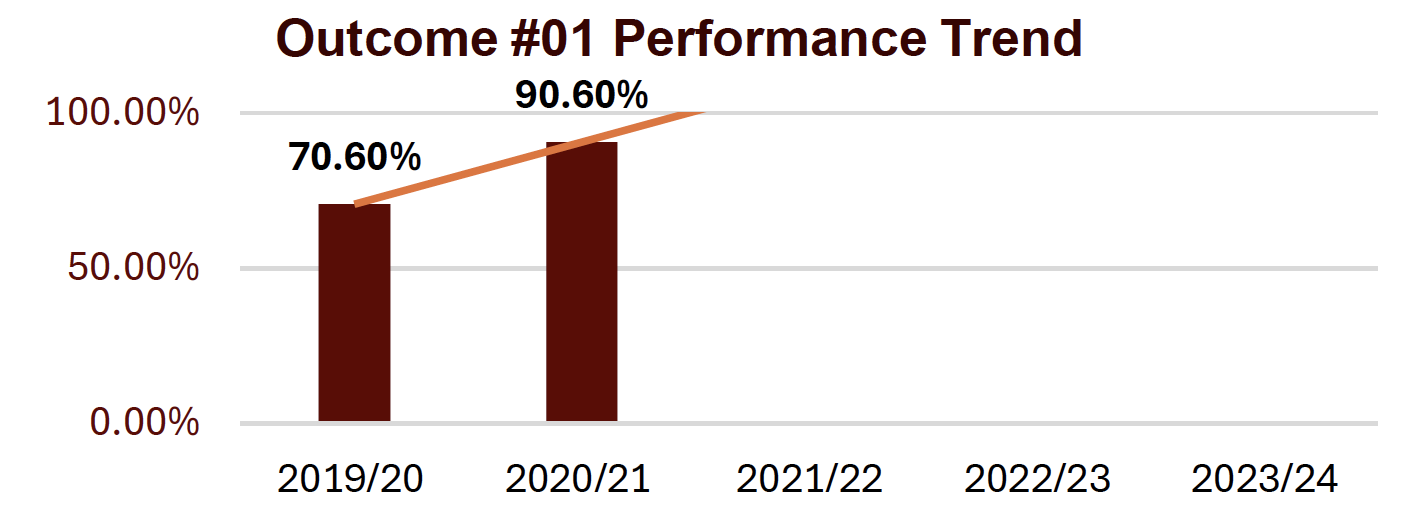
Outcome #1
- Approach (DEFINE): Graduates will apply the analytics spectrum of various types of analytics and know which type correlates to specific analytics techniques.
- Deployment (MEASURE) - Direct, Formative, Internal: 75% or better on the average exam grade in CIS 51.
- Results (ANALYZE) - Activity Scores:
- 2019/20 was 70.6%
- 2020/21 was 90.6%
- 2021/22 No Data
- 2022/23 No Data
- 2023/24 No Data
- Analysis of Results (INTERPRET/ANALYZE): Insufficient Data Reported
- Action Taken/Improvement Made (IMPROVE): Insufficient Data Reported
- Graph of Trends (CONTROL)
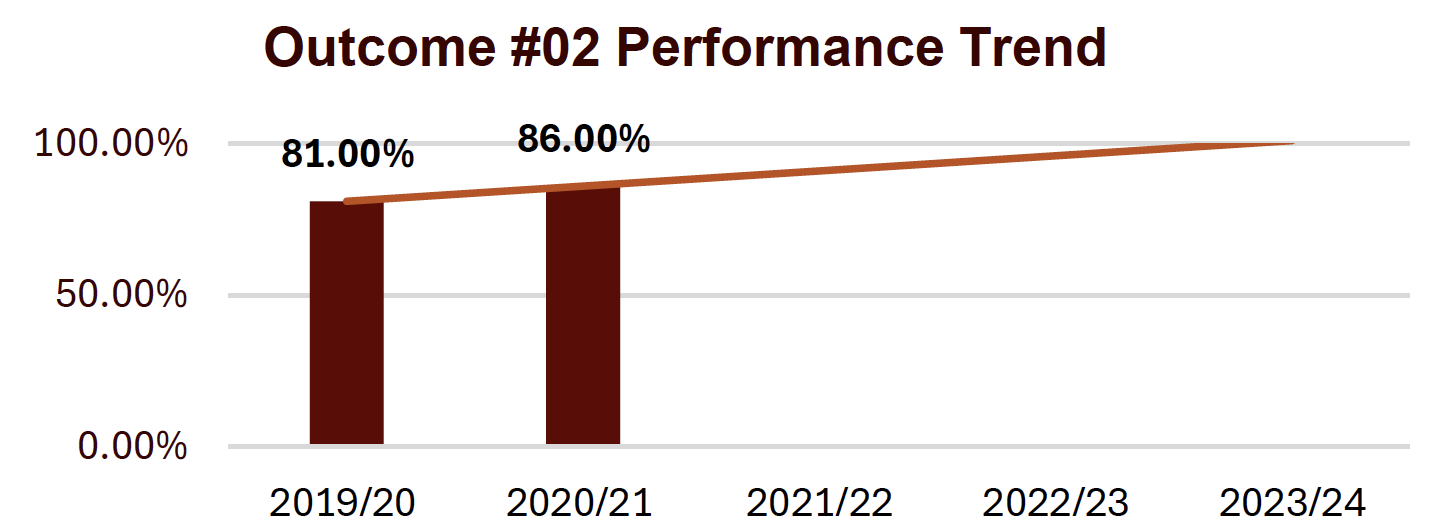
Outcome #2
- Approach (DEFINE): Graduates will apply the CRISP-DM analytics process methodology to an analytics project.
- Deployment (MEASURE) - Direct, Formative, Internal: 75% or better of the class average score for final analytics report in CIS 352.
- Results (ANALYZE) - Activity Scores:
- 2019/20 was 81%
- 2020/21 was 86%
- 2021/22 No Data
- 2022/23 No Data
- 2023/24 No Data
- Analysis of Results (INTERPRET/ANALYZE): Insufficient Data Reported
- Action Taken/Improvement Made (IMPROVE): Insufficient Data Reported
- Graph of Trends (CONTROL)
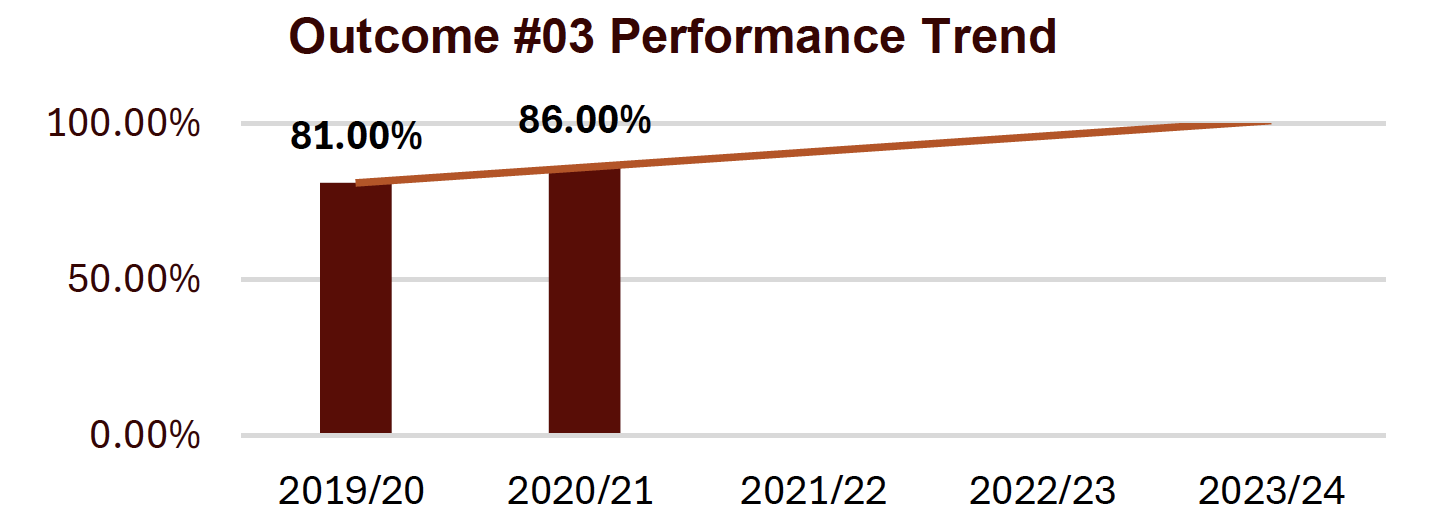
Outcome #3
- Approach (DEFINE): Graduates will explain and apply the concepts of measures versus dimensions as associated with an analytics project.
- Deployment (MEASURE) - Direct, Formative, Internal: 75% or better on the average scores for visualization exercises in CIS 151.
- Results (ANALYZE) - Activity Scores:
- 2019/20 was 81%
- 2020/21 was 86%
- 2021/22 No Data
- 2022/23 No Data
- 2023/24 No Data
- Analysis of Results (INTERPRET/ANALYZE): Insufficient Data Reported
- Action Taken/Improvement Made (IMPROVE): Insufficient Data Reported
- Graph of Trends (CONTROL)
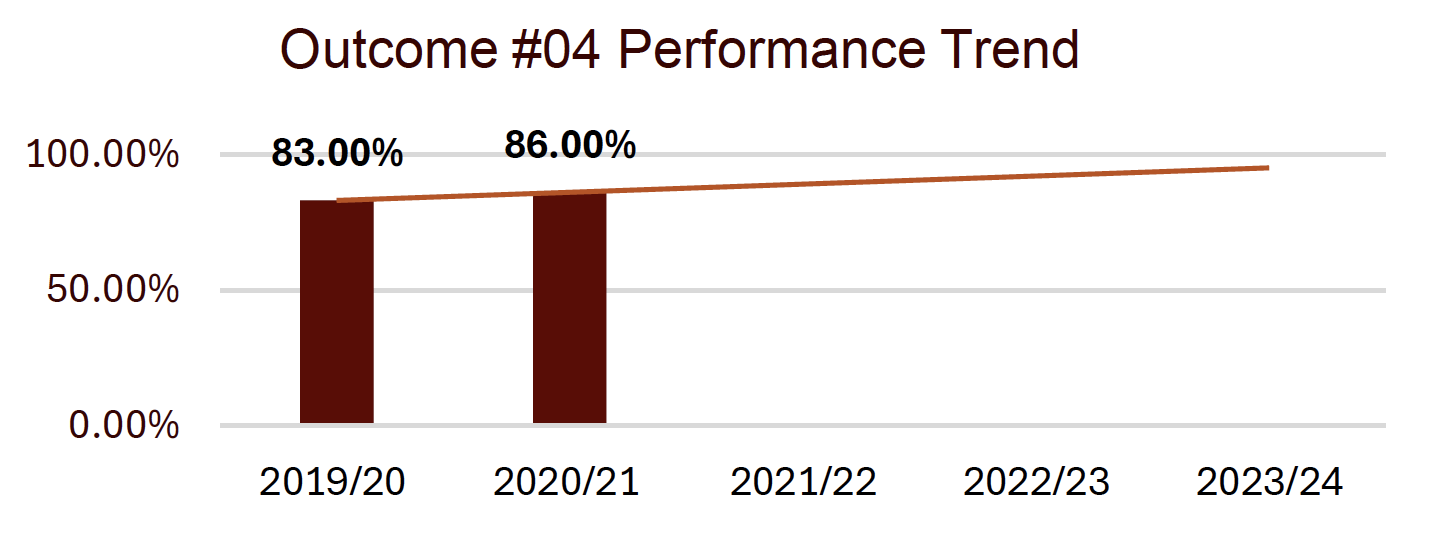
Outcome #4
- Approach (DEFINE): Graduates will create an organized presentation of analytics results for a client.
- Deployment (MEASURE) - Direct, Formative, Internal: 75% or better on the average scores for the final presentation in the CIS 352 class.
- Results (ANALYZE) - Activity Scores:
- 2019/20 was 83%
- 2020/21 was 86%
- 2021/22 No Data
- 2022/23 No Data
- 2023/24 No Data
- Analysis of Results (INTERPRET/ANALYZE): Insufficient Data Reported
- Action Taken/Improvement Made (IMPROVE): Insufficient Data Reported
- Graph of Trends (CONTROL)
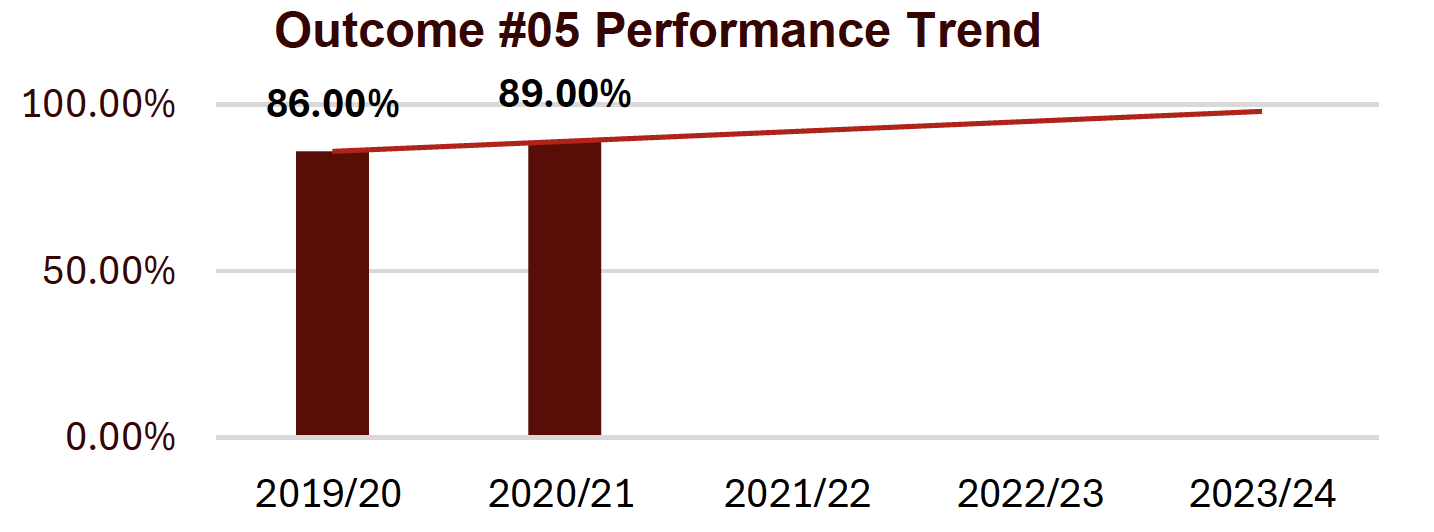
Outcome #5
- Approach (DEFINE): Graduates will describe and apply the general process to analyze unstructured data.
- Deployment (MEASURE) - Direct, Formative, Internal: 75% or better on the average scores for the final project in the CIS 351 class.
- Results (ANALYZE) - Activity Scores:
- 2019/20 was 86%
- 2020/21 was 89%
- 2021/22 No Data
- 2022/23 No Data
- 2023/24 No Data
- Analysis of Results (INTERPRET/ANALYZE): Insufficient Data Reported
- Action Taken/Improvement Made (IMPROVE): Insufficient Data Reported
- Graph of Trends (CONTROL)
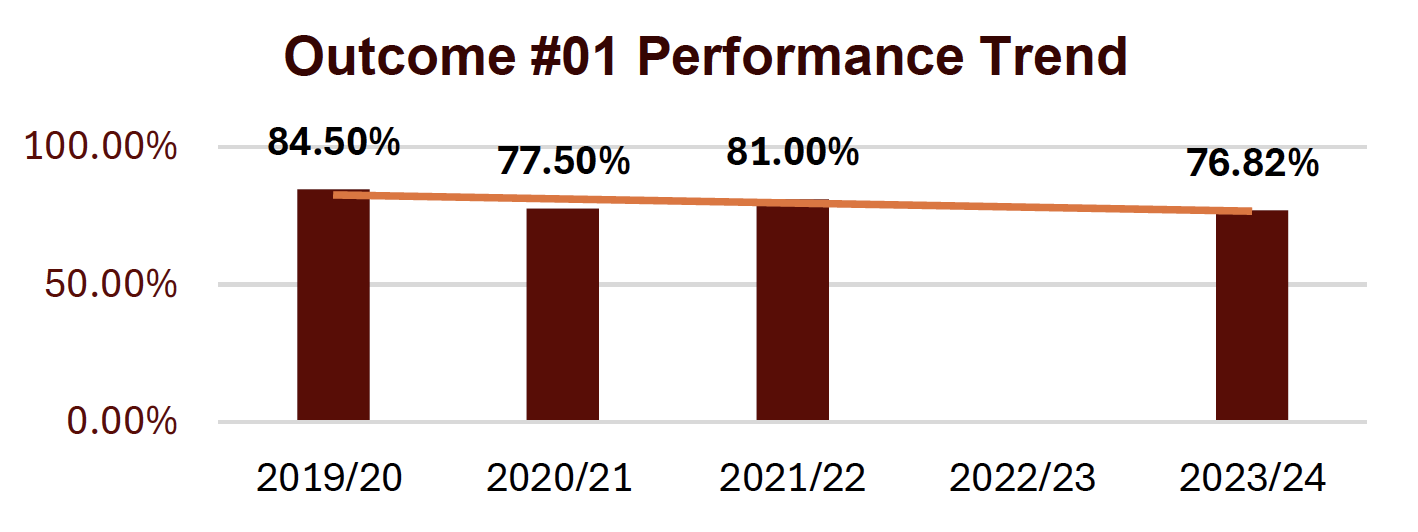
Outcome #1
- Approach (DEFINE): Graduates will analyze, interpret, & record transaction data to prepare financial statements in accordance with appropriate standards, & evaluate both tactical & strategic implications of that information.
- Deployment (MEASURE) - Direct, Formative, Internal:
- Averaged of midterm and final exam test scores of 75% or better in ACCT 310, and ACCT 311
- Averaged of midterm and final exam test scores of 75% or better in 321
- Results (ANALYZE) - Activity Scores:
- 2019/20 was 81%
- 2020/21 was 79%
- 2021/22 was 81%
- 2022/23 No Data
- 2023/24 was 76.82%
- Analysis of Results (INTERPRET/ANALYZE): Since AY2021/22, there has been an adjustment period due to the introduction of online and hybrid modalities. Also, the current pool of students consists of those who went through/completed high school during the pandemic.
- Action Taken/Improvement Made (IMPROVE): ACCT 310 and 311 continue same strategy and measurements but improve competency ACCT 321; Improvement is to continue same strategy and measurements. Continue tutoring in ACCT 210 and FIN 210.
- Graph of Trends (CONTROL)
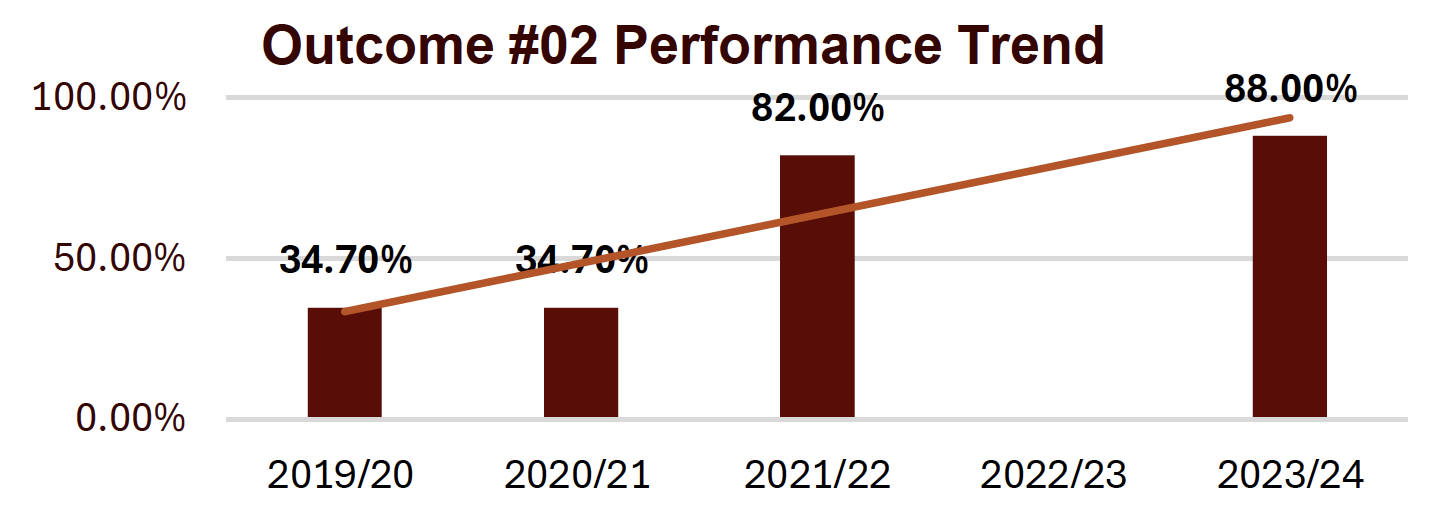
Outcome #2
- Approach (DEFINE): Graduates will understand the role of Non-GAAP measures, such as Integrated Reporting, in capturing and quantifying drivers of business and strategic value.
- Deployment (MEASURE) - Direct, Formative, Internal: Averaged scored of 75% or better on final project in Accounting 321
- Results (ANALYZE) - Activity Scores:
- 2019/20 was 34.7%
- 2020/21 was 37.7%
- 2021/22 was 82%
- 2022/23 No Data
- 2023/24 was 88%
- Analysis of Results (INTERPRET/ANALYZE):
- Since AY2021/22, there has been an adjustment period due to the increased flexibility brought about by the introduction of online and hybrid modalities.
- Action Taken/Improvement Made (IMPROVE): Improvement is to continue same strategy and measurements for ACCT 321. Continue tutoring in ACCT 210 and FIN 210.
- Graph of Trends (CONTROL)
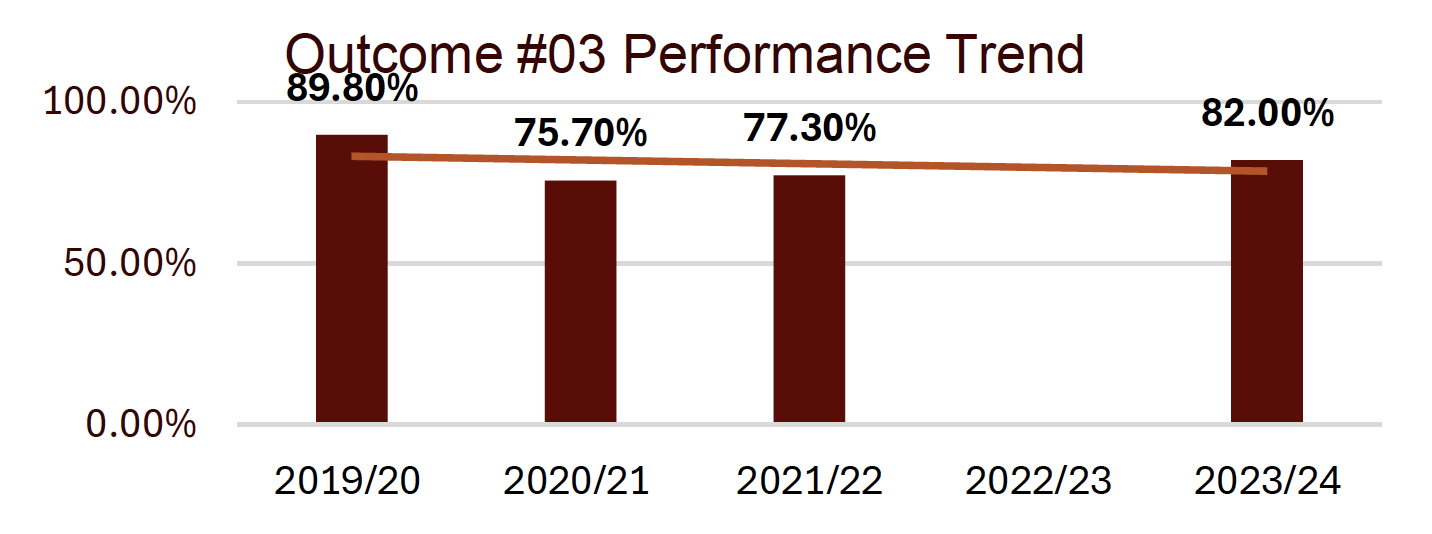
Outcome #3
- Approach (DEFINE): Graduates will demonstrate proficient soft skills as technology automates traditional rules-based functions as tax, auditing, and professionals seek more high value-added strategic-level client work.
- Deployment (MEASURE) - Direct, Formative, Internal:
- Averaged midterm test scores of 75% or better in ACCT 310
- Averaged Concepts midterm test scores of 75% or better in Acct 418
- Results (ANALYZE) - Activity Scores:
- 2019/20 was 89.8%
- 2020/21 was 75.7%
- 2021/22 was 77.3%
- 2022/23 No Data
- 2023/24 was 82%
- Analysis of Results (INTERPRET/ANALYZE): Since AY2021/22, there has been an adjustment period due to the increased flexibility brought about by the introduction of online and hybrid modalities.
- Action Taken/Improvement Made (IMPROVE): Maintain strategy and measurements. Continue tutoring in ACCT 210 and FIN 210.
- Graph of Trends (CONTROL)
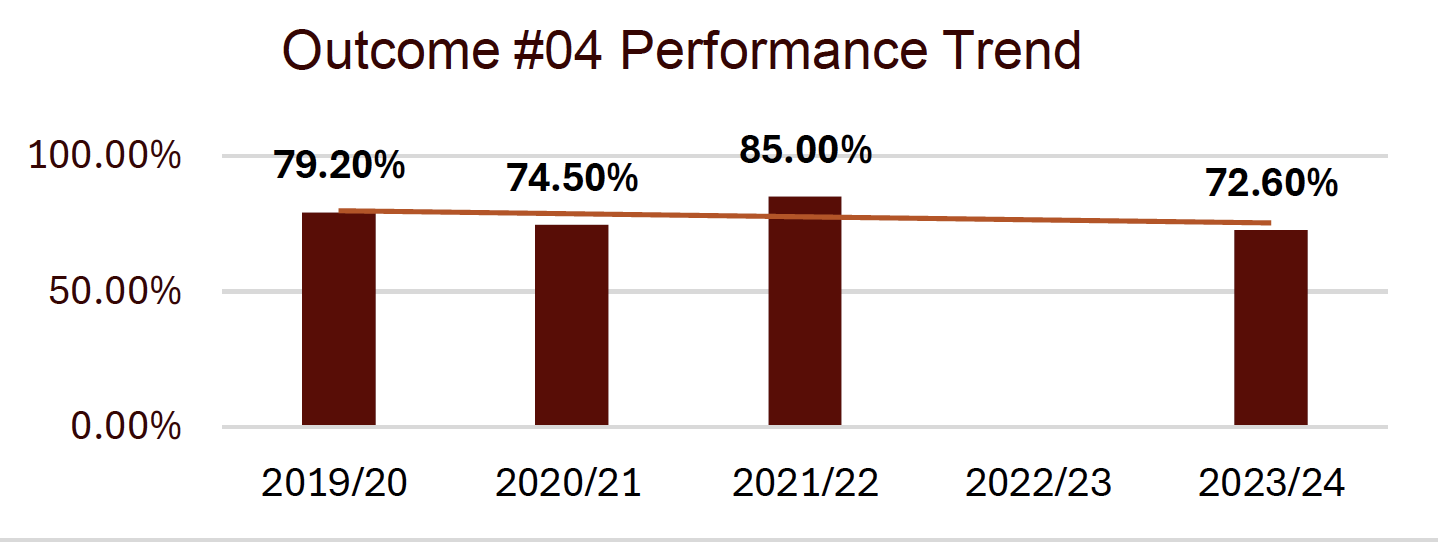
Outcome #4
- Approach (DEFINE): Graduates will explain the role and transformational impact of technology on traditional accounting rules- based functions as auditing, tax, and compliance work.
- Deployment (MEASURE) - Direct, Formative, Internal:
- Averaged Final Exam test scores of 75% or better in ACCT 311
- Average scores of 75% or better in Technology project in ACCT 312
- Results (ANALYZE) - Activity Scores:
- 2019/20 was 79.2%
- 2020/21 was 74.5%
- 2021/22 was 85%
- 2022/23 No Data
- 2023/24 was 72%
- Analysis of Results (INTERPRET/ANALYZE): Since AY2021/22, there has been an adjustment period due to the increased flexibility brought about by the introduction of online and hybrid modalities.
- Action Taken/Improvement Made (IMPROVE):
- Maintain strategy for ACCT311. ACCT 321: Enhance degree of difficulty again this year, extended time allotted as combination in- class and take-home exam.
- Continue tutoring in ACCT 210 and FIN 210.
- Graph of Trends (CONTROL)
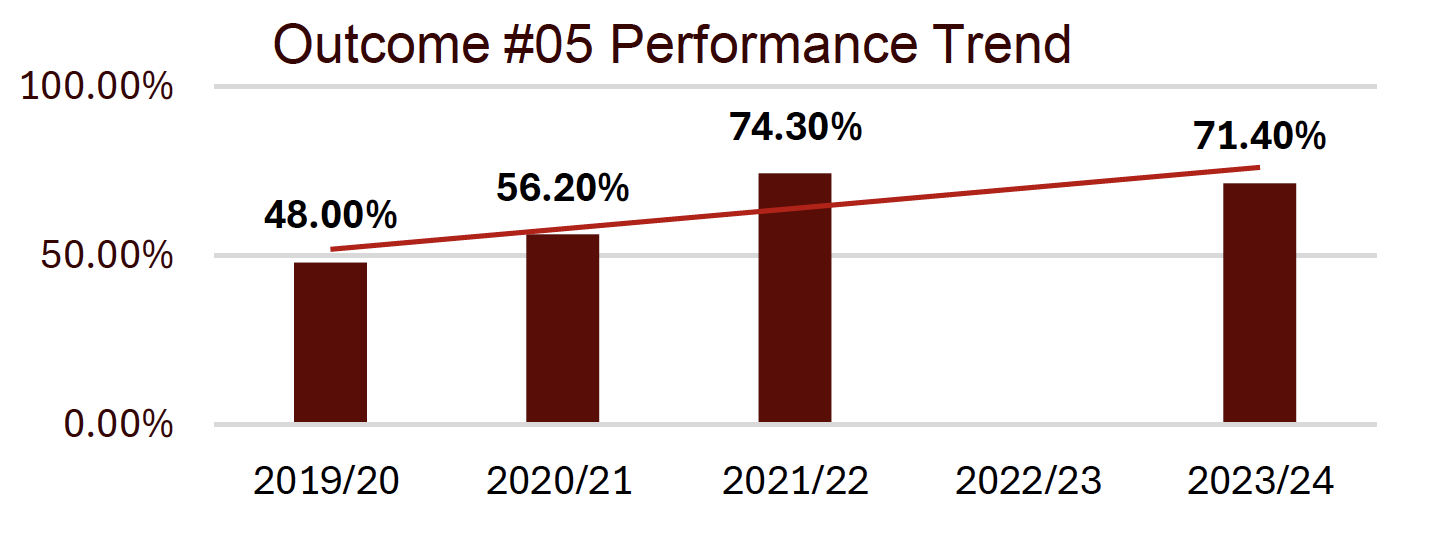
Outcome #5
- Approach (DEFINE): Graduates will convey trust and integrity as the foundation of the global business network, and to consider the role of moral courage and ethics in the business professions.
- Deployment (MEASURE) - Direct, Formative, Internal: Average score of 75% or better on Ethics Case Study
- Results (ANALYZE) - Activity Scores:
- 2019/20 was 48%
- 2020/21 was 56.2%
- 2021/22 was 74.3%
- 2022/23 No Data
- 2023/24 was 71.4%
- Analysis of Results (INTERPRET/ANALYZE): Since AY2021/22, there has been an adjustment period due to the increased flexibility brought about by the introduction of online and hybrid modalities.
- Action Taken/Improvement Made (IMPROVE): Maintain current strategy and measurements. Continue tutoring in ACCT 210 and FIN 210.
- Graph of Trends (CONTROL)
Outcome #1
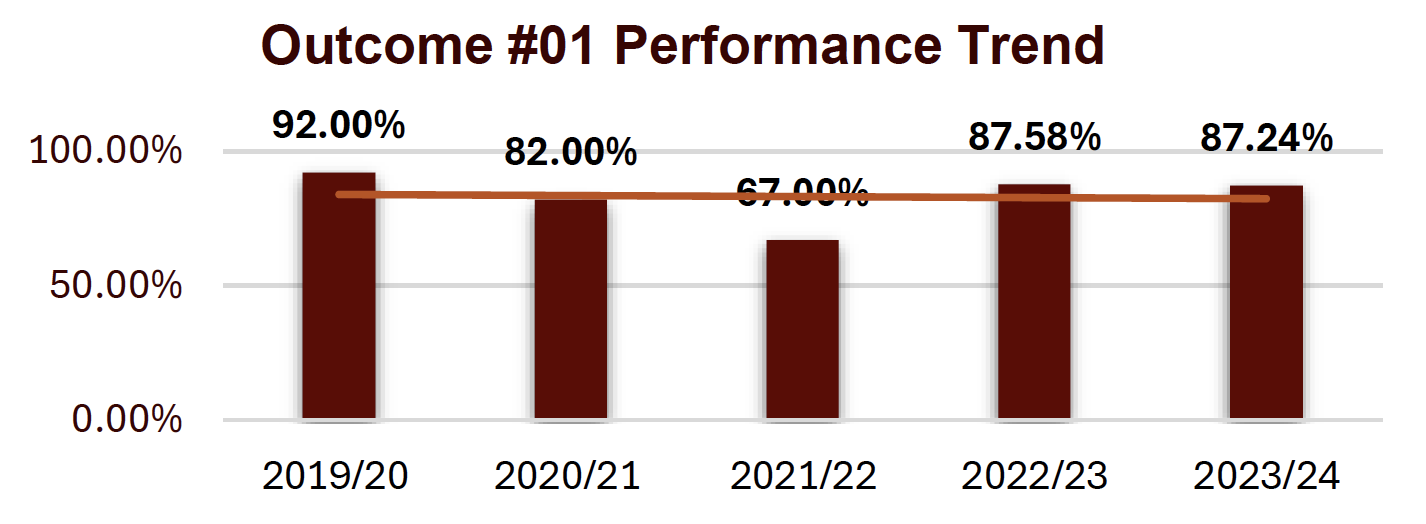
- Approach (DEFINE): Graduates will demonstrate knowledge of management and leadership theories.
- Deployment (MEASURE) - Direct, Formative, Internal: Target: Minimum 70% of point total for the assignments used in MGT 281.
- Results (ANALYZE) - Activity Scores:
- 2019/20 was 92%
- 2020/21 was 82%
- 2021/22 was 67%
- 2022/23 was 87.58%
- 2023/24 No Data
- Analysis of Results (INTERPRET/ANALYZE): There is still an association between students who do not take notes and how well those students do on the Exam! Although the numbers seems to be shrinking.
- Action Taken/Improvement Made (IMPROVE): AY2024-2025 Improvement Plan Assignment is successful, continue with current strategy.
- Graph of Trends (CONTROL)
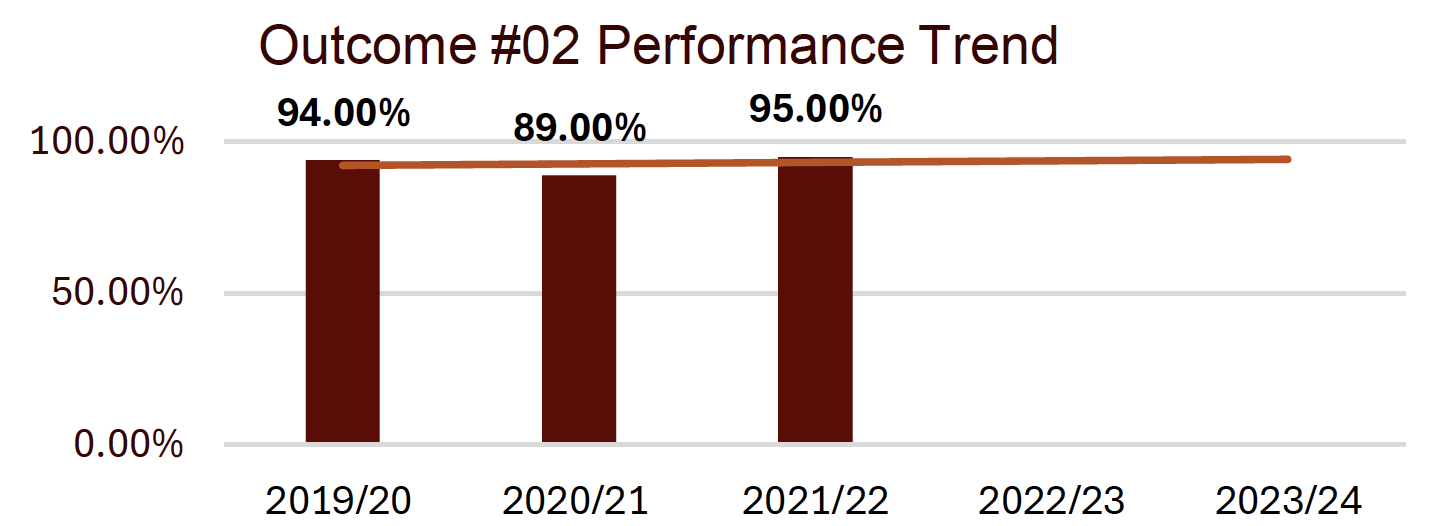
Outcome #2
- Approach (DEFINE): Graduates will examine, interpret and apply qualitative and quantitative data and research knowledge to address complex problems.
- Deployment (MEASURE) - Direct, Formative, Internal: Minimum average of 85% of total points on Experimental Design proposal (BADM 332)
- Results (ANALYZE) - Activity Scores:
- 2019/20 was 94%
- 2020/21 was 89%
- 2021/22 was 95%
- 2022/23 No Data
- 2023/24 No Data
- Analysis of Results (INTERPRET/ANALYZE): Same issue with students not taking notes and then doing poorly on assignments.
- Action Taken/Improvement Made (IMPROVE): AY2024-2025 Improvement Plan Assignment evaluation will take place at the end of the current academic year, and necessary strategies for improvement will be implemented at that time.
- Graph of Trends (CONTROL)
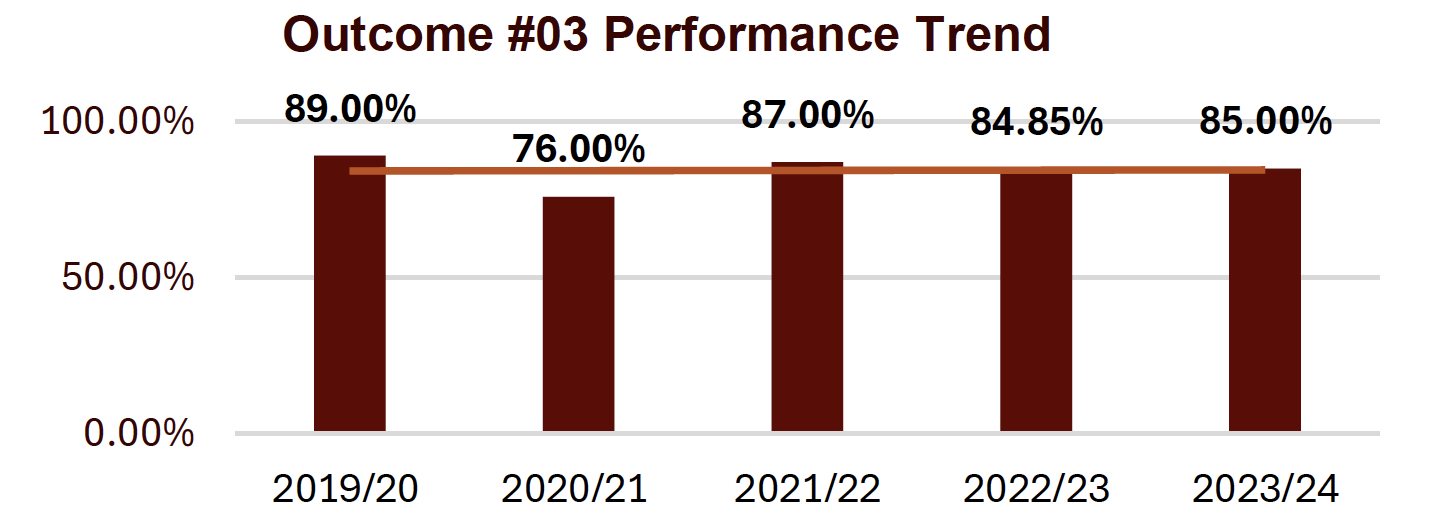
Outcome #3
- Approach (DEFINE): Graduates will show evidence of logic-based problem solving, analysis-based decision-making, strategic thinking and application of business theory to solving practical management problems.
- Deployment (MEASURE) - Direct, Formative, Internal: 75%+ total score on CAPSIM Foundation Business Simulation: BADM 439 - Relative Weighting Score, Competition Round Debriefs and Final Shareholder Debrief.
- Results (ANALYZE) - Activity Scores:
- 2019/20 was 89%
- 2020/21 was 76%
- 2021/22 was 87%
- 2022/23 was 84.85%
- 2023/24 No Data
- Analysis of Results (INTERPRET/ANALYZE): The GlobalDNA® Business Simulation is more robust than the previous simulation and students remain unable to consult with students from previous classes
- Action Taken/Improvement Made (IMPROVE): AY2024-2025 Improvement Plan Class average remains consistent, continue with existing strategy.
- Graph of Trends (CONTROL)
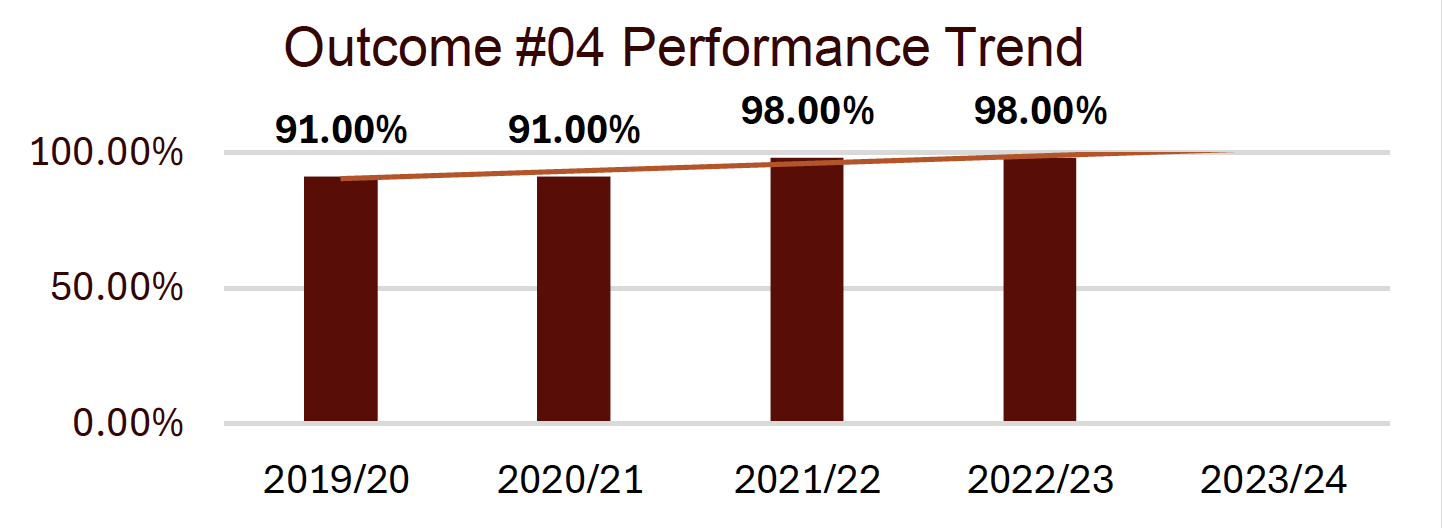
Outcome #4
- Approach (DEFINE): Graduates will produce creative business solutions.
- Deployment (MEASURE) - Direct, Formative, Internal: Minimum 85% class average of total points on the Business Plan Assignment. BADM332
- Results (ANALYZE) - Activity Scores:
- 2019/20 was 91%
- 2020/21 was 91%
- 2021/22 was 98%
- 2022/23 was 98%
- 2023/24 No Data
- Analysis of Results (INTERPRET/ANALYZE): Most students really appreciate an opportunity to complete a Business Plan.
- Action Taken/Improvement Made (IMPROVE): AY2024-2025 Improvement Plan Assignment evaluation will take place at the end of the current academic year, and necessary strategies for improvement will be implemented at that time.
- Graph of Trends (CONTROL)
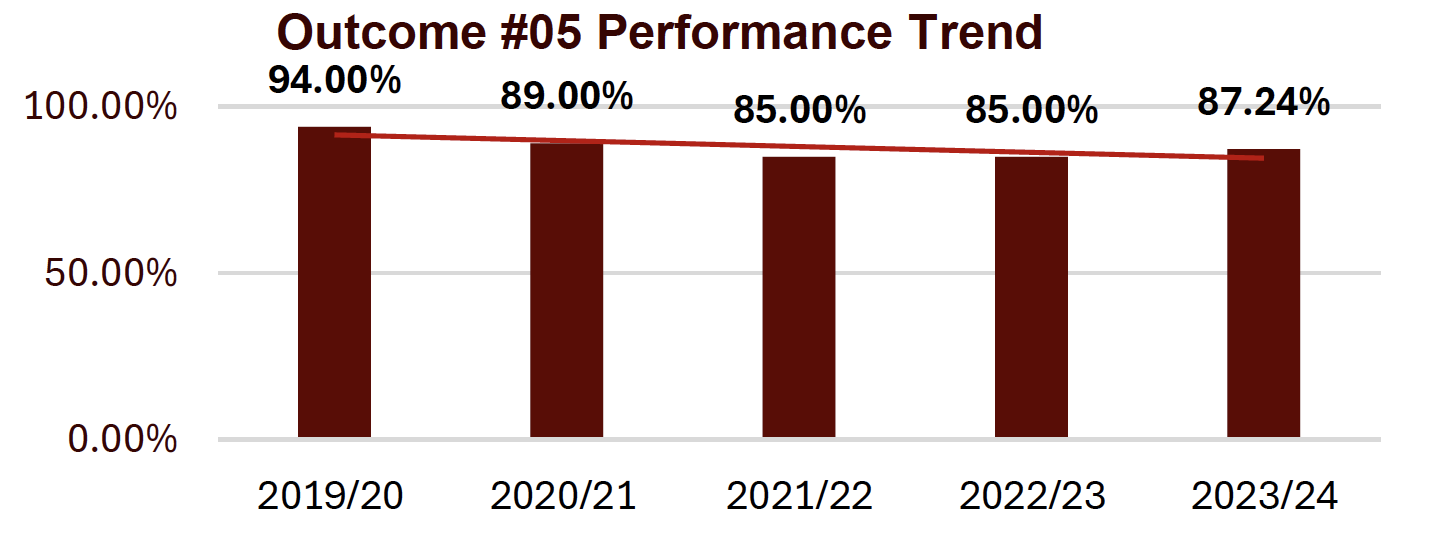
Outcome #5
- Approach (DEFINE): Graduates will identify accepted ethical business standards.
- Deployment (MEASURE) - Direct, Formative, Internal: Minimum 85% class average on combined point totals of two MGT 281 Ethics assignment
- Results (ANALYZE) - Activity Scores:
- 2019/20 was 94%
- 2020/21 was 89%
- 2021/22 was 85%
- 2022/23 was 85%
- 2023/24 was 87.24%
- Analysis of Results (INTERPRET/ANALYZE): Ethics in business practice, especially related to copyright of software, seems like a real challenge to students.
- Action Taken/Improvement Made (IMPROVE): AY2024-2025 Improvement Plan Continue with existing strategy.
- Graph of Trends (CONTROL)
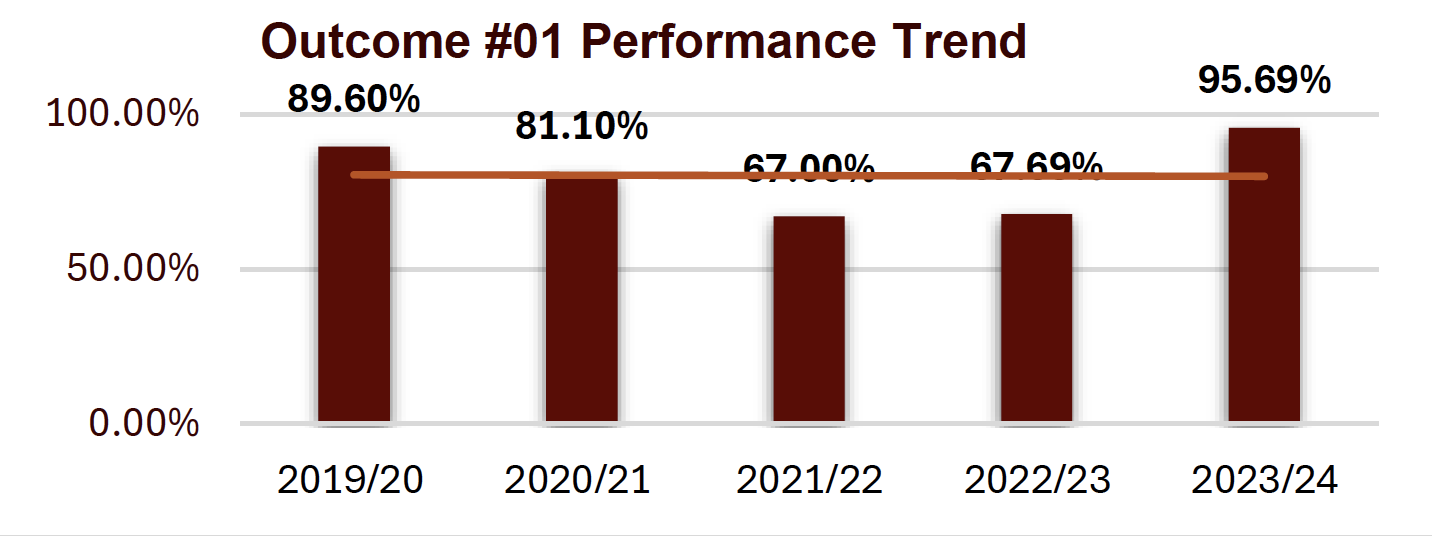
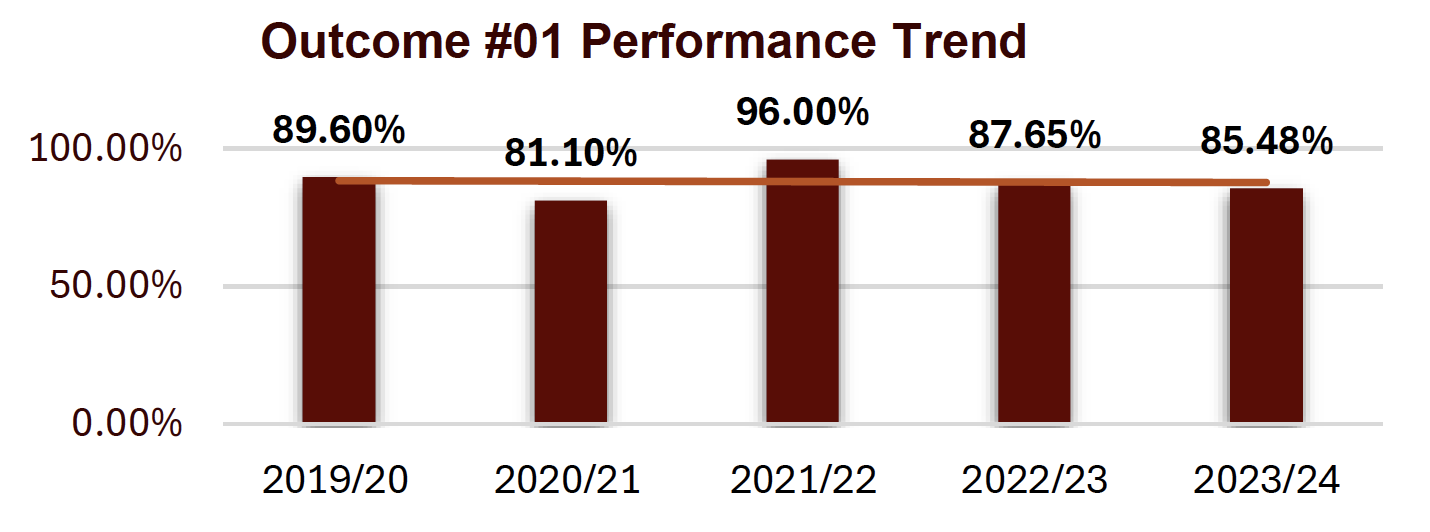
Outcome #1
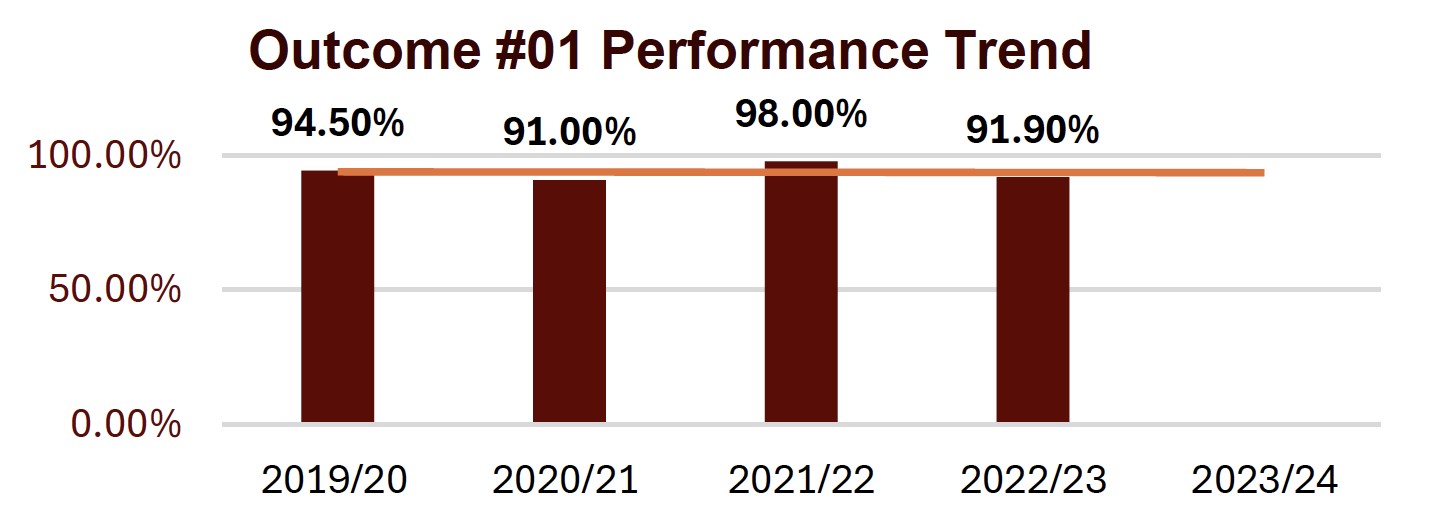
- Approach (DEFINE): Graduates will demonstrate knowledge of management and leadership theories.
- Deployment (MEASURE) - Direct, Formative, Internal: Target: Minimum 70% of point total for the assignments used in MGT 281.
- Results (ANALYZE) - Activity Scores:
- 2019/20 was 89.6%
- 2020/21 was 81.1%
- 2021/22 was 67%
- 2022/23 was 67.69%
- 2023/24 was 95.69%
- Analysis of Results (INTERPRET/ANALYZE):
- AY2022-2023 Results: Class average improved from 67% in the previous year to 67.69%
- AY2023-2024 Results: Class average improved to 95.69%
- Action Taken/Improvement Made (IMPROVE):
- Plan for AY2023-2024: Continue with the existing strategy.
- AY2024-2025 Improvement Plan: Average score improved significantly. Continue with existing strategy.
- Graph of Trends (CONTROL)
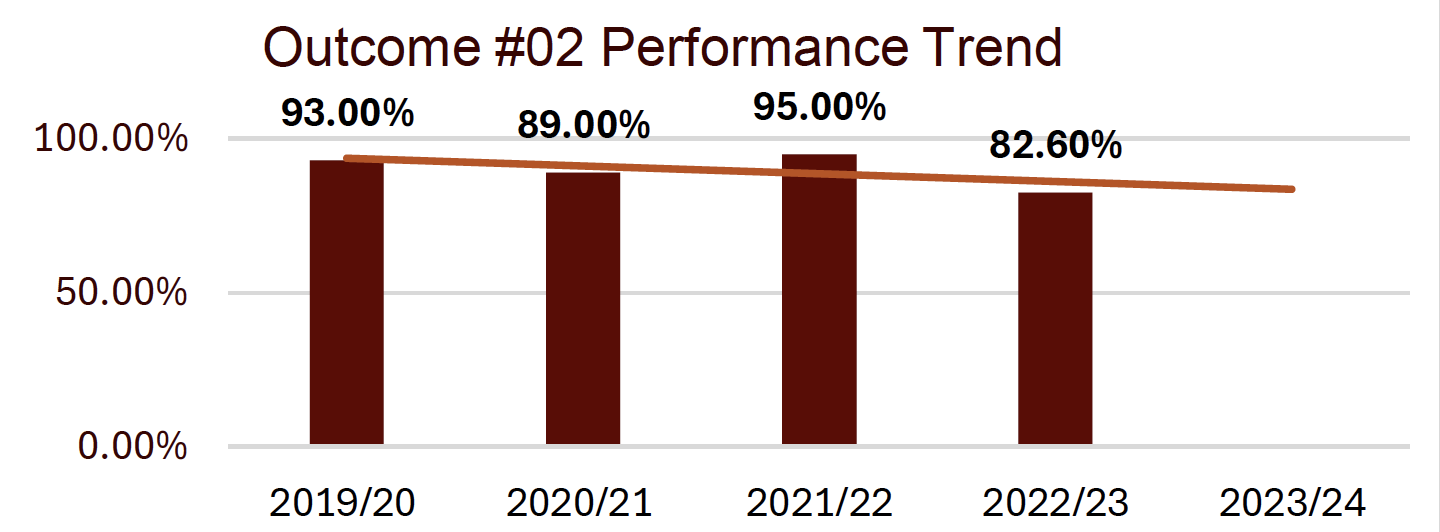
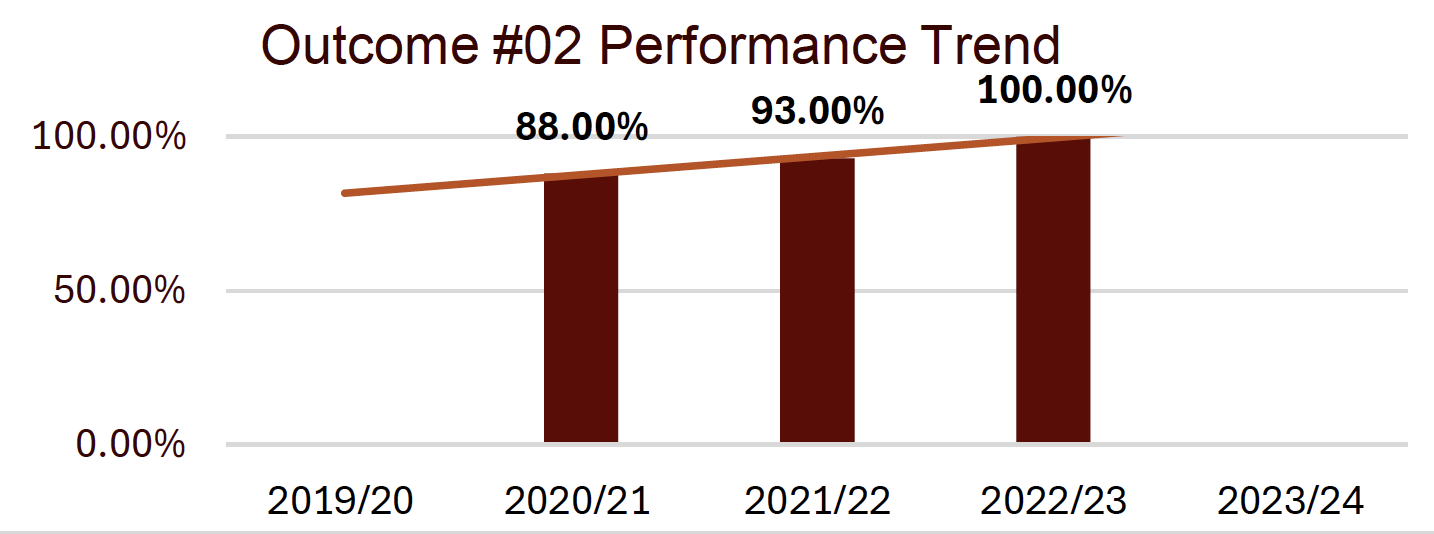
Outcome #2
- Approach (DEFINE): Graduates will examine, interpret and apply qualitative and quantitative data and research knowledge to address complex problems.
- Deployment (MEASURE) - Direct, Formative, Internal: Minimum average of 85% of total points on Experimental Design proposal.
- Results (ANALYZE) - Activity Scores:
- 2019/20 was 93%
- 2020/21 was 89%
- 2021/22 was 95%
- 2022/23 was 82.6%
- 2023/24 No Data
- Analysis of Results (INTERPRET/ANALYZE):
- AY2021-2022 (95%).
- AY2022-2023: Class average score was 82.6%, although much lower prior year, still far exceeded the established standard of 70%.
- AY2023-2024: Results No Data
- Action Taken/Improvement Made (IMPROVE):
- BADM-332 has been replaced by BADM-230 Business Law.
- AY2024-2025: Assignment evaluation will take place at the end of the current academic year, and necessary strategies for improvement will be implemented at that time.
- Graph of Trends (CONTROL)
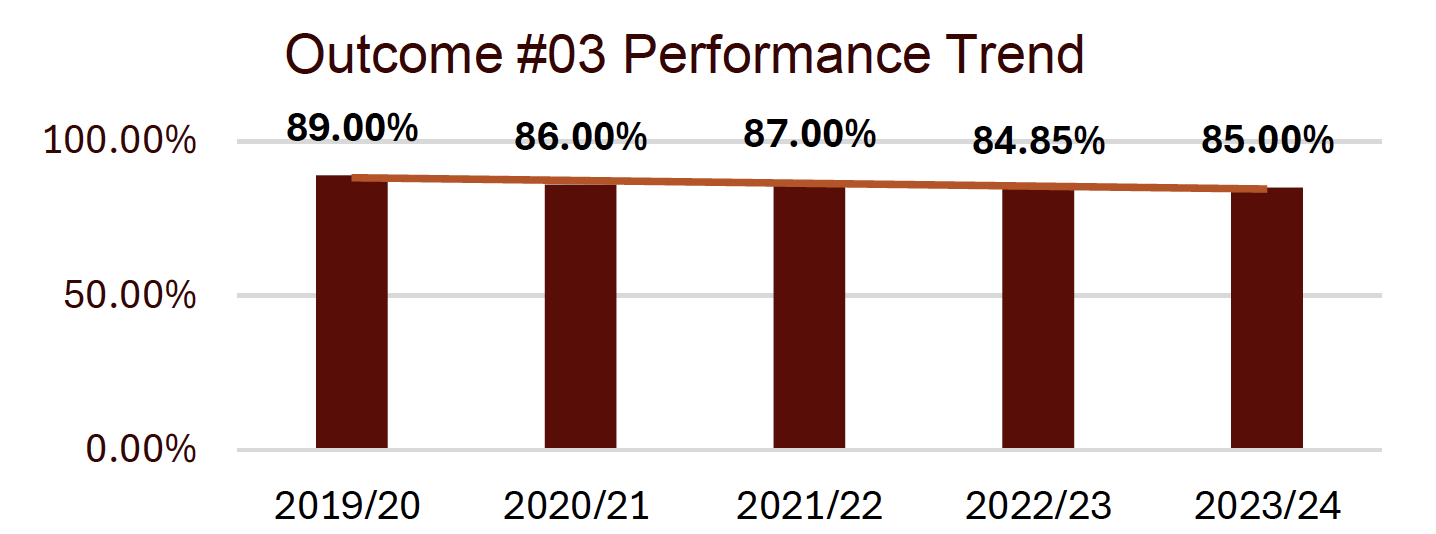
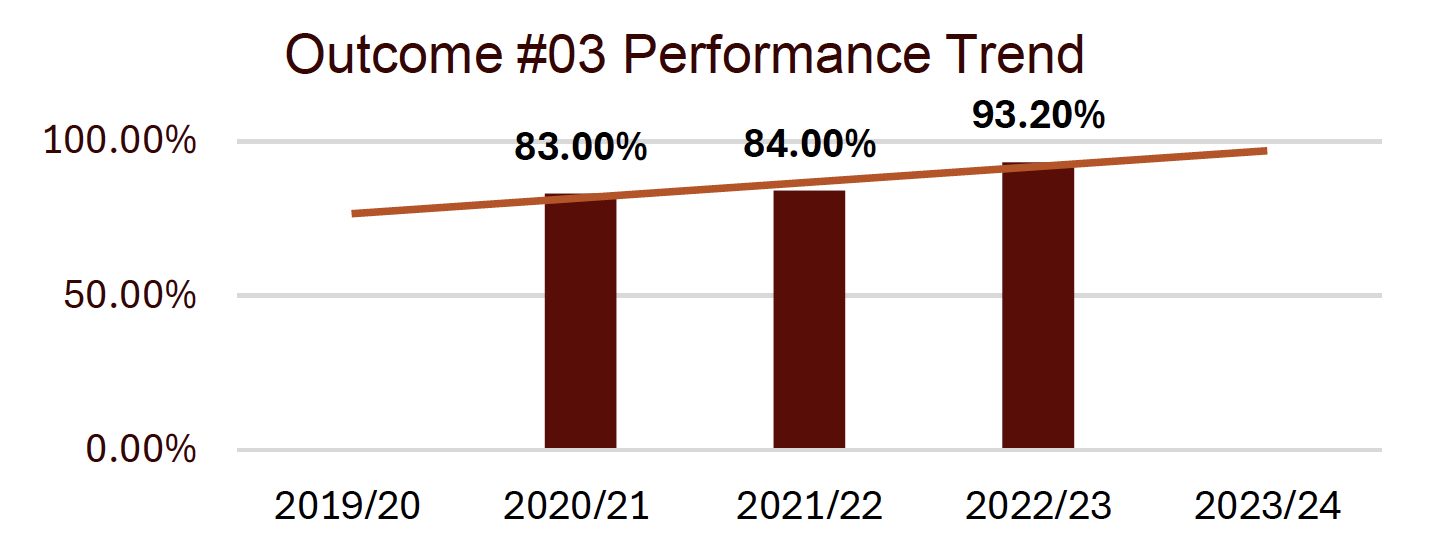
Outcome #3
- Approach (DEFINE): Graduates will show evidence of logic-based problem solving, analysis-based decision-making, strategic thinking and application of business theory to solving practical management problems.
- Deployment (MEASURE) - Direct, Formative, Internal: =/> of 75% total score on CAPSIM Foundation Business Simulation. This includes Relative Weighting Score, Competition Round Debriefs and Final Shareholder Debrief.
- Results (ANALYZE) - Activity Scores:
- 2019/20 was 89%
- 2020/21 was 86%
- 2021/22 was 87%
- 2022/23 was 84.85%
- 2023/24 was 85%
- Analysis of Results (INTERPRET/ANALYZE):
- AY2022-2023: Class average score was 84.85%
- AY2023-2024 Results: Class average score was 85%
- Action Taken/Improvement Made (IMPROVE):
- Plan for AY2023-2024: Prior year data not available. Continue with the existing strategy.
- AY2024-2025 Improvement Plan: Class average is being maintained at approximately 85%. Continue with existing strategy.
- Graph of Trends (CONTROL)
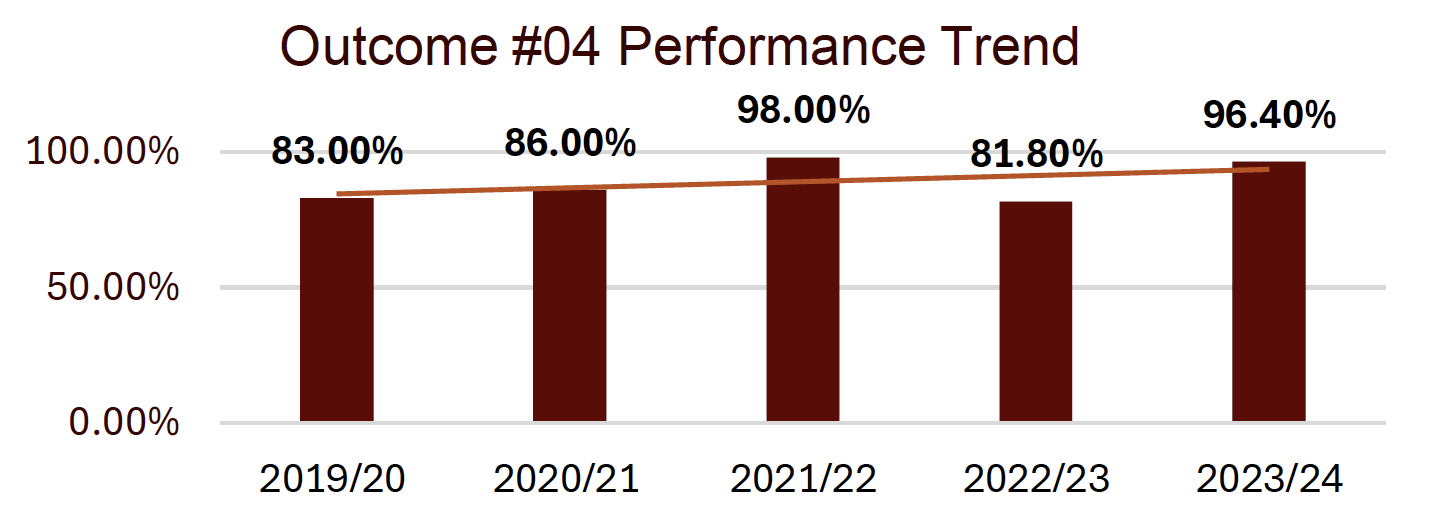
Outcome #4
- Approach (DEFINE): Graduates will produce creative business solutions.
- Deployment (MEASURE) - Direct, Formative, Internal: Minimum 85% class average of total points on the Business Plan Assignment.
- Results (ANALYZE) - Activity Scores:
- 2019/20 was 83%
- 2020/21 was 86%
- 2021/22 was 98%
- 2022/23 was 81.8%
- 2023/24 was 96.4%
- Analysis of Results (INTERPRET/ANALYZE):
- AY2021-2022 (98%).
- AY2022-2023: Class average for the research paper and presentation was 81.8%.
- AY2023-2024 Results Class average was 96.4%
- Action Taken/Improvement Made (IMPROVE): AY2024-2025 Improvement Plan Assignment evaluation will take place at the end of the current academic year, and necessary strategies for improvement will be implemented at that time.
- Graph of Trends (CONTROL)
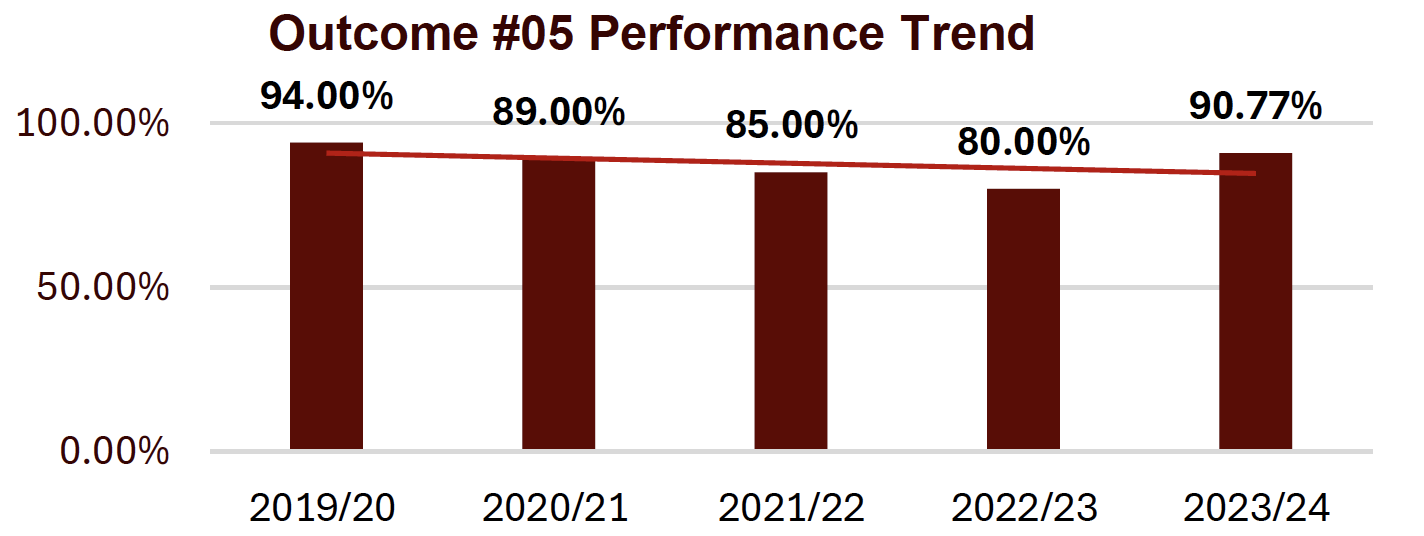
Outcome #5
- Approach (DEFINE): Graduates will identify accepted ethical business standards.
- Deployment (MEASURE) - Direct, Formative, Internal: Minimum 85% class average on combined point totals of two MGT 281 Ethics assignment
- Results (ANALYZE) - Activity Scores:
- 2019/20 was 94%
- 2020/21 was 89%
- 2021/22 was 85%
- 2022/23 was 80%
- 2023/24 was 90.77%
- Analysis of Results (INTERPRET/ANALYZE):
- AY2021-2022 -85%
- AY2022-2023: 80%, lower than prior year; however, it was still well above the threshold of 70%
- AY2023-2024 Results Class average was 90.77%
- Action Taken/Improvement Made (IMPROVE): AY2024-2025 Improvement Plan Evaluate existing strategy to address external factors, such as poor class attendance.
- Graph of Trends (CONTROL)
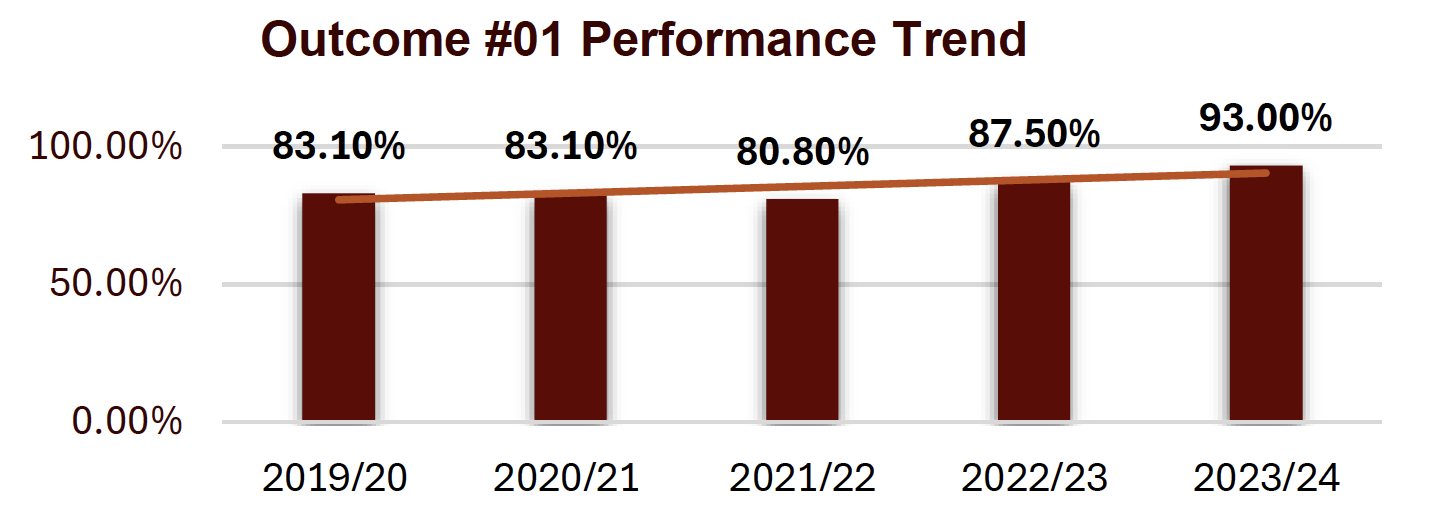
Outcome #1
- Approach (DEFINE): Graduates will apply the analytics spectrum of various types of analytics and know which type correlates to specific analytics techniques.
- Deployment (MEASURE) - Direct, Formative, Internal: 75% or better on the applied projects score in CIS 351.
- Results (ANALYZE) - Activity Scores:
- 2019/20 was 83.1%
- 2020/21 was 83.1%
- 2021/22 was 80.8%
- 2022/23 was 87.5%
- 2023/24 was 93%
- Analysis of Results (INTERPRET/ANALYZE): AY2023-2024 Results: The average final score was 93.0% which exceeded the 75% threshold.
- Action Taken/Improvement Made (IMPROVE): Improvements for 2024-2025 Since the field of analytics is rapidly changing, outcomes and goals will need to be monitored and updated over time.
- Graph of Trends (CONTROL)
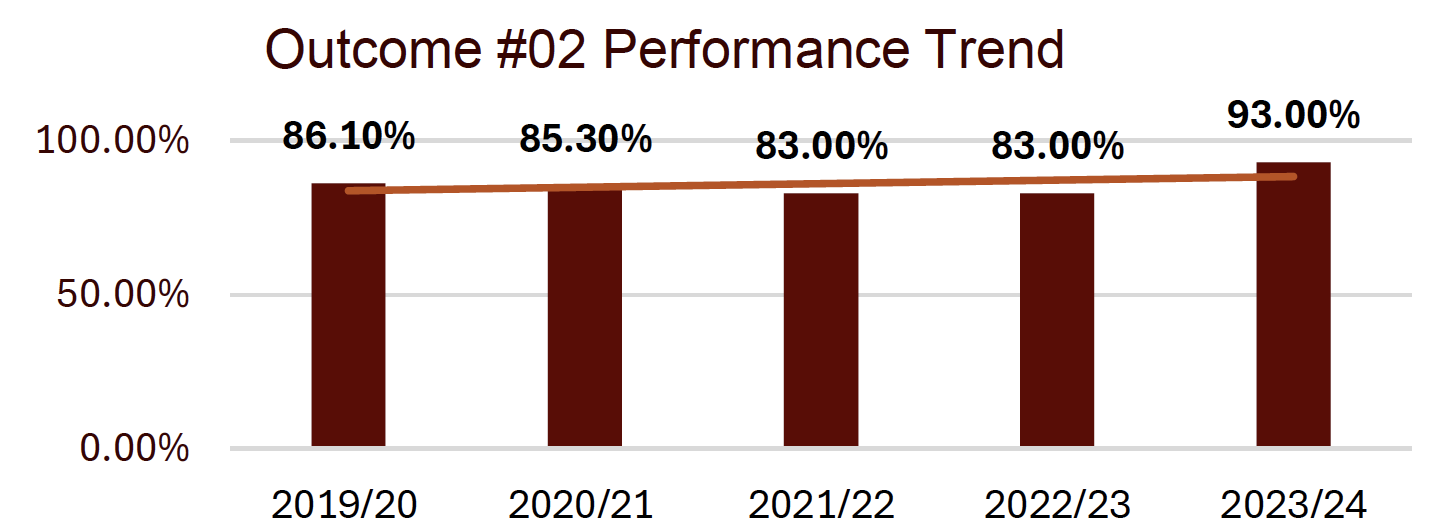
Outcome #2
- Approach (DEFINE): Graduates will apply the CRISP-DM analytics process methodology to an analytics project.
- Deployment (MEASURE) - Direct, Formative, Internal: 75% or better of the class average score for final analytics project in CIS 456.
- Results (ANALYZE) - Activity Scores:
- 2019/20 was 86.1%
- 2020/21 was 85.3%
- 2021/22 was 83%
- 2022/23 was 83%
- 2023/24 was 93%
- Analysis of Results (INTERPRET/ANALYZE): AY2023-2024 Results: The average final score was 93.0% which exceeded the 75% threshold.
- Action Taken/Improvement Made (IMPROVE): Improvements for 2024-2025 Since the field of analytics is rapidly changing, outcomes and goals will need to be monitored and updated over time.
- Graph of Trends (CONTROL)
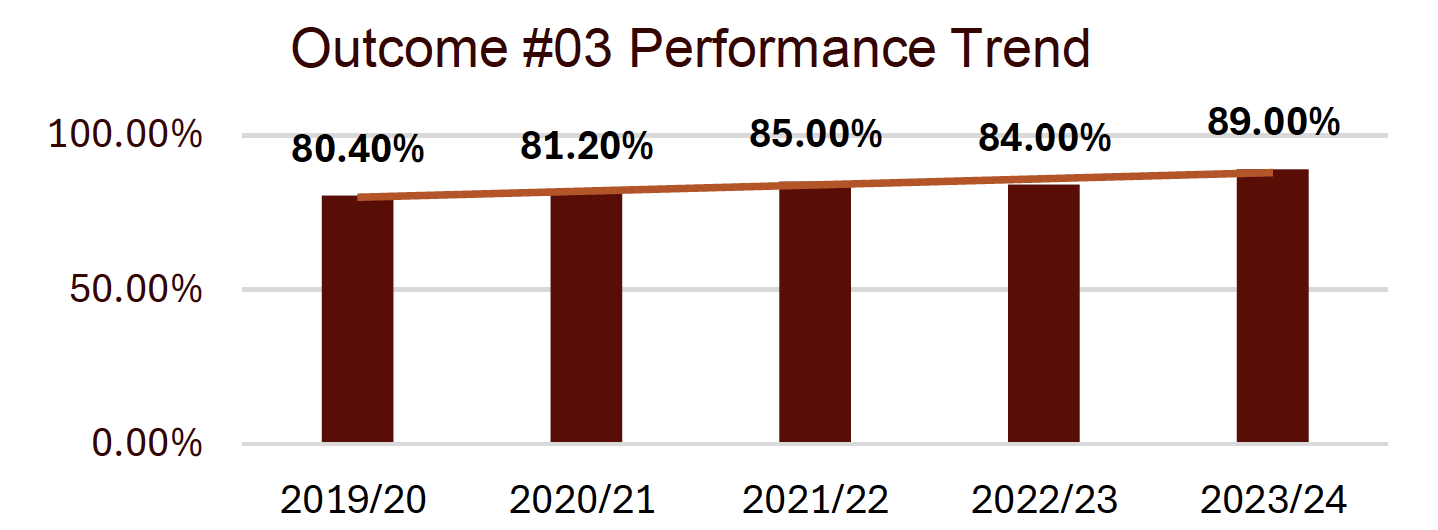
Outcome #3
- Approach (DEFINE): Graduates will describe and apply the concepts of measures versus dimensions as associated with an analytics project.
- Deployment (MEASURE) - Direct, Formative, Internal: 75% or better on the average scores for visualization exercises in CIS 151.
- Results (ANALYZE) - Activity Scores:
- 2019/20 was 80.4%
- 2020/21 was 81.2%
- 2021/22 was 85%
- 2022/23 was 84%
- 2023/24 was 89%
- Analysis of Results (INTERPRET/ANALYZE): AY2023-2024 Results: The average score for all five visualization exercises was 89% which exceeded the 75% threshold.
- Action Taken/Improvement Made (IMPROVE): Improvements for 2024-2025 Since the field of analytics is rapidly changing, outcomes and goals will need to be monitored and updated over time.
- Graph of Trends (CONTROL)
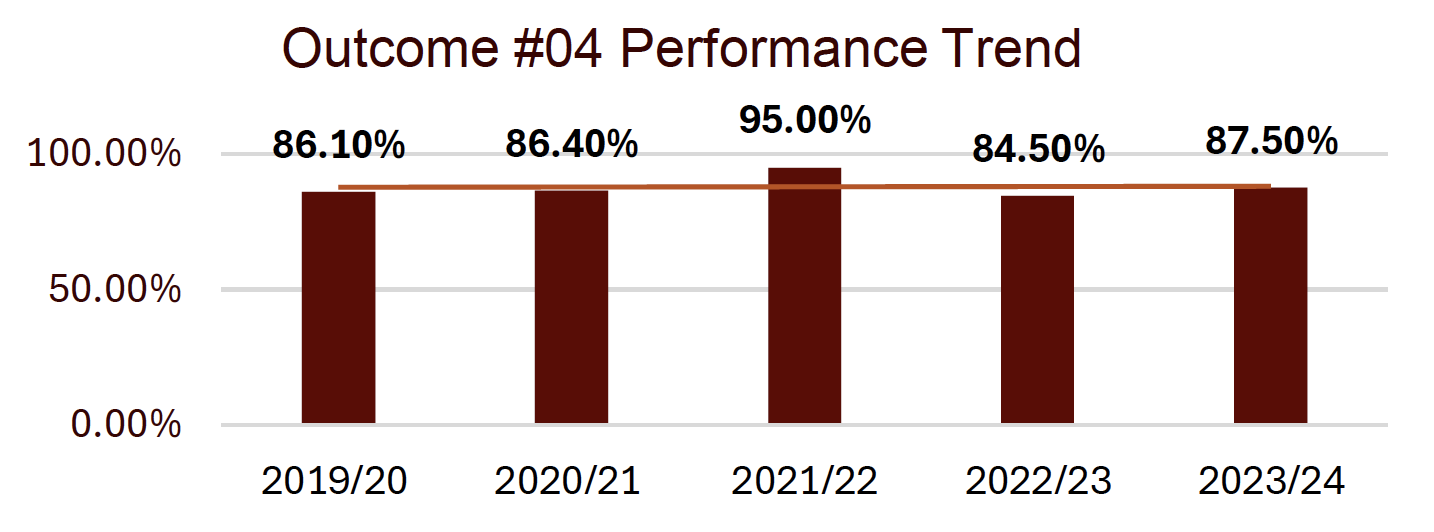
Outcome #4
- Approach (DEFINE): Graduates will discuss and create an organized presentation of analytics results for a client.
- Deployment (MEASURE) - Direct, Formative, Internal: 75% or better on the average scores for the final presentation in the CIS 359 class.
- Results (ANALYZE) - Activity Scores:
- 2019/20 was 86.1%
- 2020/21 was 86.4%
- 2021/22 was 95%
- 2022/23 was 84.5%
- 2023/24 was 87.5%
- Analysis of Results (INTERPRET/ANALYZE): AY2023-2024 Results: The average final score on the project and presentation was 87.5% which exceeded the 75% threshold.
- Action Taken/Improvement Made (IMPROVE): Improvements for 2024-2025 Since the field of analytics is rapidly changing, outcomes and goals will need to be monitored and updated over time.
- Graph of Trends (CONTROL)
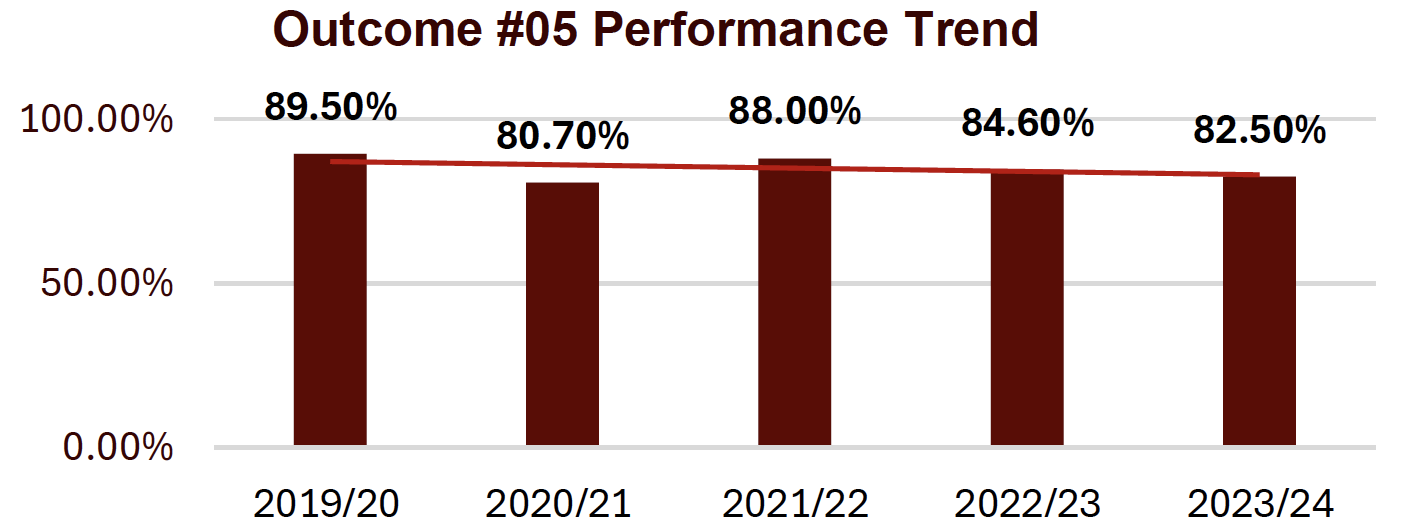
Outcome #5
- Approach (DEFINE): Graduates will discuss and apply the general process to analyze unstructured data.
- Deployment (MEASURE) - Direct, Formative, Internal: 75% or better on the average scores for the final project in the CIS 351 class.
- Results (ANALYZE) - Activity Scores:
- 2019/20 was 89.5%
- 2020/21 was 80.7%
- 2021/22 was 88%
- 2022/23 was 84.6%
- 2023/24 was 82.5%
- Analysis of Results (INTERPRET/ANALYZE): 2023-2024: Results The average score for the final project in CIS 351 was an 82.5% which exceeds the threshold of 75%.
- Action Taken/Improvement Made (IMPROVE): Improvements for 2024-2025 Since the field of analytics is rapidly changing, outcomes and goals will need to be monitored and updated over time.
- Graph of Trends (CONTROL)
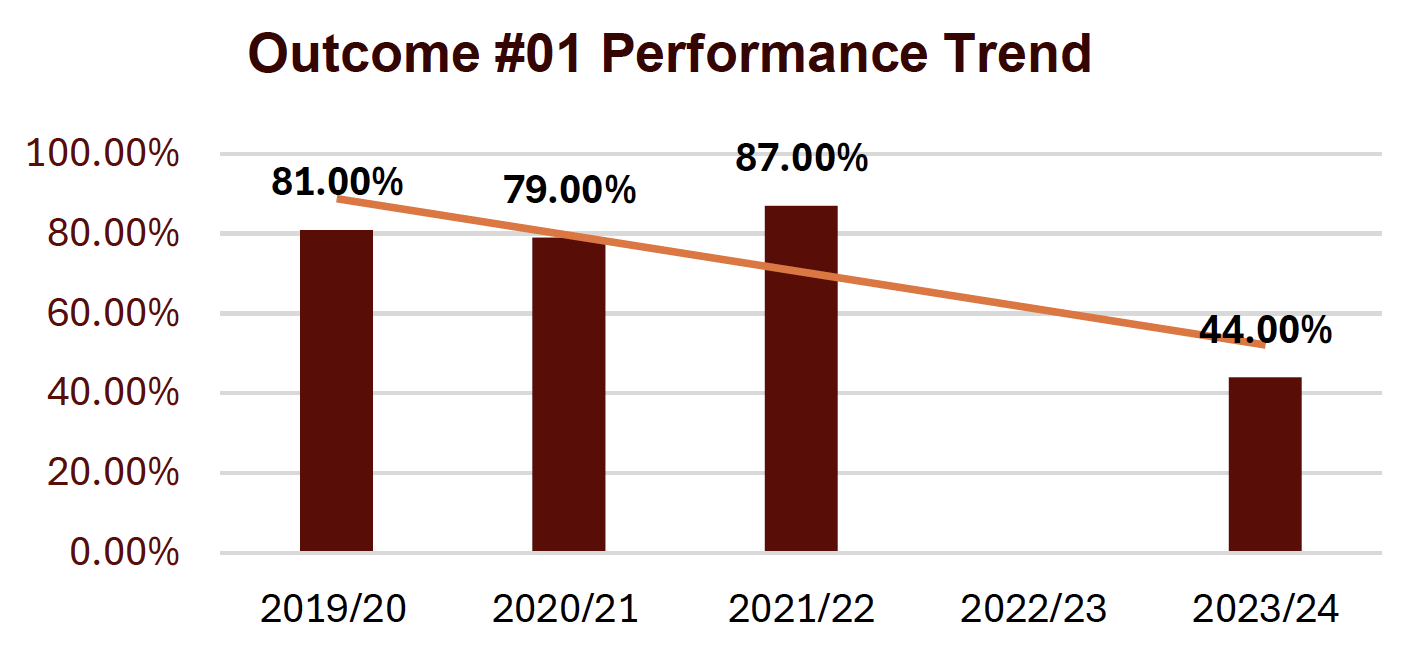
Outcome #1
- Approach (DEFINE): Graduates will identify value maximizing alternatives and make decisions which maximize value. (Asset Pricing)
- Deployment (MEASURE) - Direct, Formative, Internal: Target score of 65% on exam questions from required finance course in the school of business major
- Results (ANALYZE) - Activity Scores:
- 2019/20 was 81%
- 2020/21 was 79%
- 2021/22 was 87%
- 2022/23 No Data
- 2023/24 was 44%
- Analysis of Results (INTERPRET/ANALYZE): Since AY2021/22, there has been an adjustment period due to the introduction of online and hybrid modalities. Also, the current pool of students consists of those who went through/completed high school during the pandemic.
- Action Taken/Improvement Made (IMPROVE): This pool of students who entered into major business courses seemed to struggle with technical courses. Since the Fall of 2021, we have offered have offered tutoring 5 days a week in ACCT 210 and FIN 210. Faculty have observed noticeable improvements in students performance.
- Graph of Trends (CONTROL)
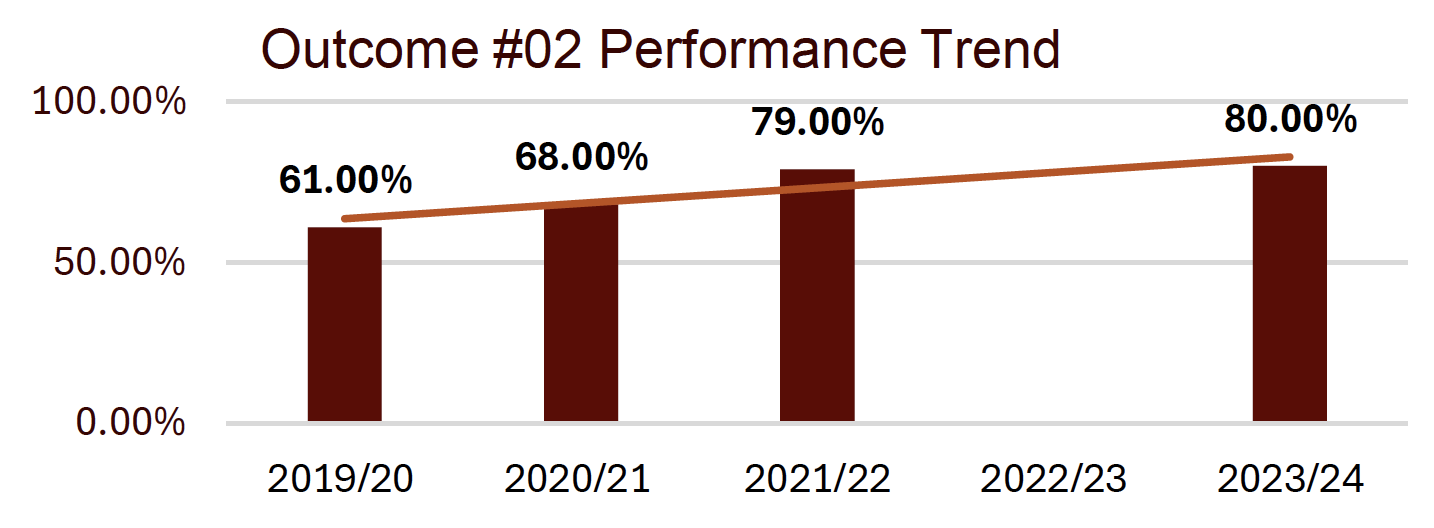
Outcome #2
- Approach (DEFINE): Graduates will use financial statements to determine the financial condition of an organization. (Asset Pricing)
- Deployment (MEASURE) - Direct, Formative, Internal: Target score of 65% on exam questions from required finance course in the School of Business major.
- Results (ANALYZE) - Activity Scores:
- 2019/20 was 61%
- 2020/21 was 68%
- 2021/22 was 79%
- 2022/23 No Data
- 2023/24 was 80%
- Analysis of Results (INTERPRET/ANALYZE): Since AY2021/22, there has been an adjustment period due to the increased flexibility brought about by the introduction of online and hybrid modalities.
- Action Taken/Improvement Made (IMPROVE): This pool of students who entered into major business courses seemed to struggle with technical courses. Since the Fall of 2021, we have offered have offered tutoring 5 days a week in ACCT 210 and FIN 210. Faculty have observed noticeable improvements in students performance.
- Graph of Trends (CONTROL)
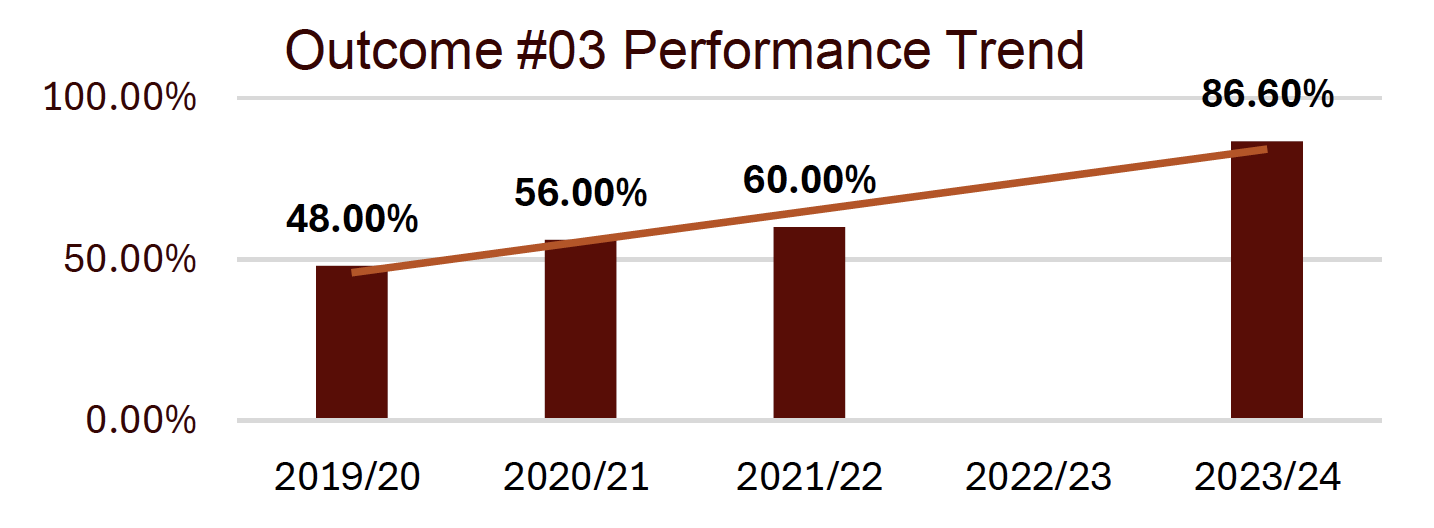
Outcome #3
- Approach (DEFINE): Graduates will identify the relative efficiency of capital markets and the impact of the agency problem on market efficiency (Capital Markets)
- Deployment (MEASURE) - Direct, Formative, Internal: Target score of 65% on exam questions from required finance course in the School of Business major
- Results (ANALYZE) - Activity Scores:
- 2019/20 was 48%
- 2020/21 was 56%
- 2021/22 was 60%
- 2022/23 No Data
- 2023/24 was 86.6%
- Analysis of Results (INTERPRET/ANALYZE): Since AY2021/22, there has been an adjustment period due to the increased flexibility brought about by the introduction of online and hybrid modalities.
- Action Taken/Improvement Made (IMPROVE): This pool of students who entered into major business courses seemed to struggle with technical courses. Since the Fall of 2021, we have offered have offered tutoring 5 days a week in ACCT 210 and FIN 210. Faculty have observed noticeable improvements in students performance.
- Graph of Trends (CONTROL)
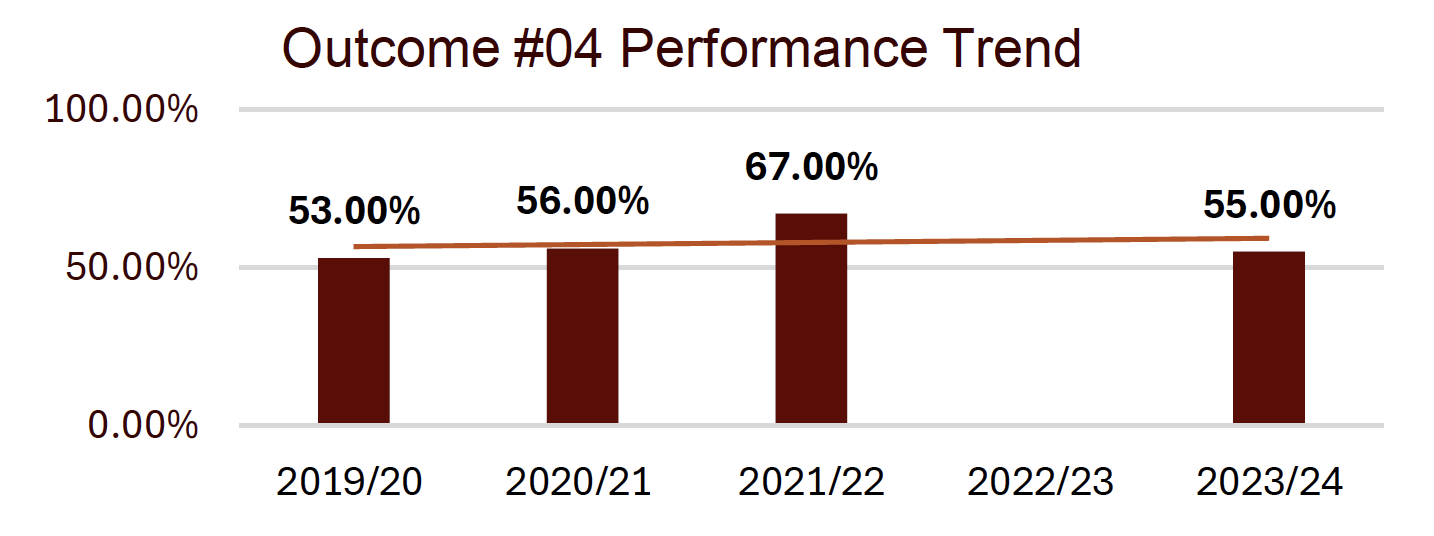
Outcome #4
- Approach (DEFINE): Graduates will describe the role of financial intermediaries, investors, regulators, and users of capital (Capital Markets)
- Deployment (MEASURE) - Direct, Formative, Internal: Target score of 65% on exam questions from required finance course in the School of Business major
- Results (ANALYZE) - Activity Scores:
- 2019/20 was 53%
- 2020/21 was 56%
- 2021/22 was 67%
- 2022/23 No Data
- 2023/24 was 55%
- Analysis of Results (INTERPRET/ANALYZE): Since AY2021/22, there has been an adjustment period due to the increased flexibility brought about by the introduction of online and hybrid modalities.
- Action Taken/Improvement Made (IMPROVE): This pool of students who entered into major business courses seemed to struggle with technical courses. Since the Fall of 2021, we have offered have offered tutoring 5 days a week in ACCT 210 and FIN 210. Faculty have observed noticeable improvements in students performance.
- Graph of Trends (CONTROL)
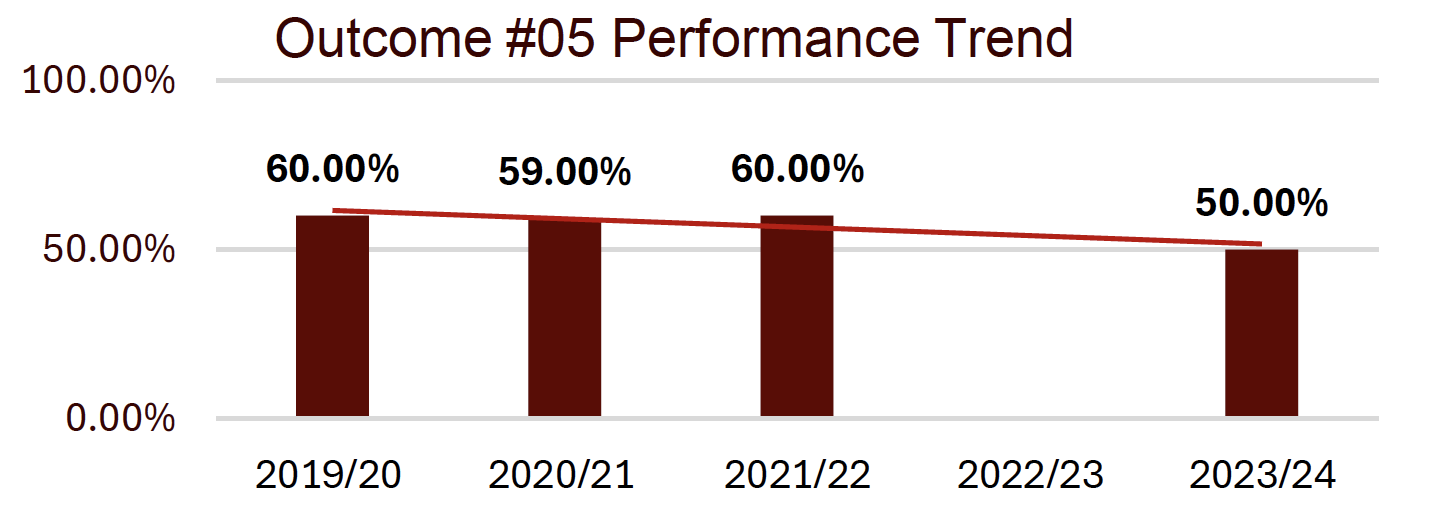
Outcome #5
- Approach (DEFINE): Graduates will quantify risk and the opportunity cost of capital (Risk Management)
- Deployment (MEASURE) - Direct, Formative, Internal: Target score of 65% on exam questions from required finance course in the School of Business major
- Results (ANALYZE) - Activity Scores:
- 2019/20 was 60%
- 2020/21 was 59%
- 2021/22 was 60%
- 2022/23 No Data
- 2023/24 was 50%
- Analysis of Results (INTERPRET/ANALYZE): Since AY2021/22, there has been an adjustment period due to the increased flexibility brought about by the introduction of online and hybrid modalities.
- Action Taken/Improvement Made (IMPROVE): This pool of students who entered into major business courses seemed to struggle with technical courses. Since the Fall of 2021, we have offered have offered tutoring 5 days a week in ACCT 210 and FIN 210. Faculty have observed noticeable improvements in students performance.
- Graph of Trends (CONTROL)
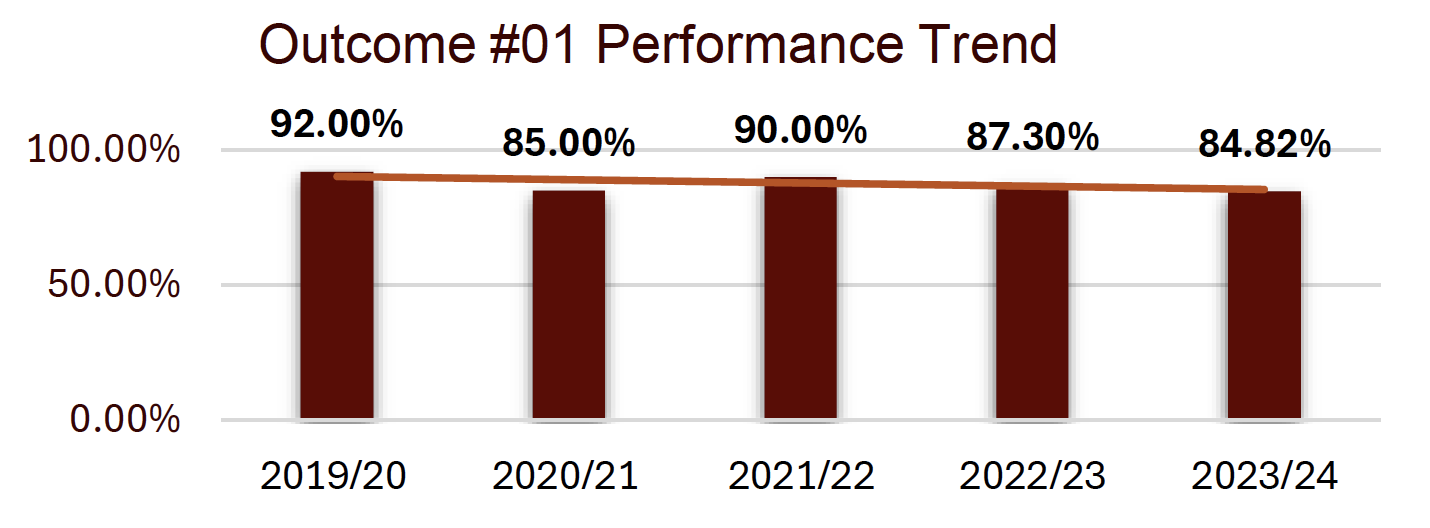
Outcome #1
- Approach (DEFINE): Graduates will explain concepts related to the marketing mix of product, price, place, promotion and the contribution of each to an organization.
- Deployment (MEASURE) - Direct, Formative, Internal: Class averaged score of individual presentation on the brand story >/= 80% in MKTG290
- Results (ANALYZE) - Activity Scores:
- 2019/20 was 81%
- 2020/21 was 79%
- 2021/22 was 90%
- 2022/23 was 87.3%
- 2023/24 was 84.82%
- Analysis of Results (INTERPRET/ANALYZE): The brand story (marketing mix strategy) told through the analysis of an S&P 500 company had the average score of 84.82%, about three (3) points lower than the prior year; still consistently exceeding the established standard.
- Action Taken/Improvement Made (IMPROVE): Continue with the existing plan; by encouraging more student class , especially the students class participation as well as group research efforts.
- Graph of Trends (CONTROL)
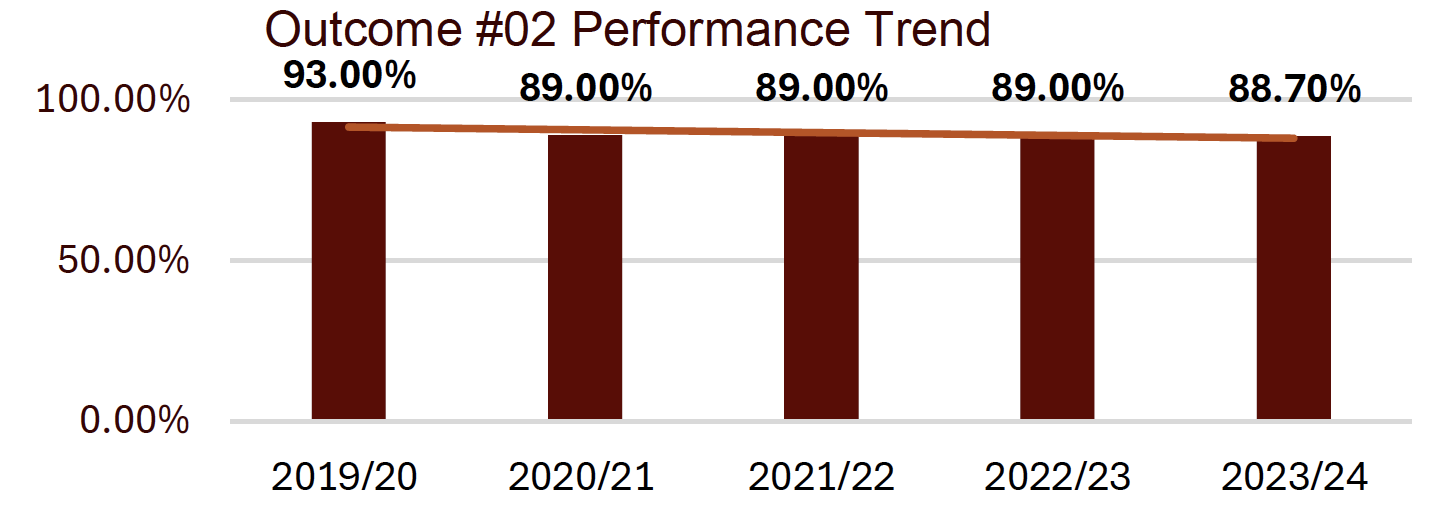
Outcome #2
- Approach (DEFINE): Graduates will recognize the competitive and other external forces which impact an organization’s ability to execute a marketing plan.
- Deployment (MEASURE) - Direct, Formative, Internal: Average overall class percentage on the Marketing Plan >/=80% in MKTG290
- Results (ANALYZE) - Activity Scores:
- 2019/20 was 93%
- 2020/21 was 89%
- 2021/22 was 89%
- 2022/23 was 89%
- 2023/24 was 88.7%
- Analysis of Results (INTERPRET/ANALYZE): Marketing plan overall score was comparable to the prior year’s results, at 88.70%, which still exceeded the established standard of 80%.
- Action Taken/Improvement Made (IMPROVE): Students will be required to pick an S & P 500 company for their final research to demonstrate their grasps of the marketing planning concepts and the brand story. Since S&P companies have financial and marketing data available in the public domain.
- Graph of Trends (CONTROL)
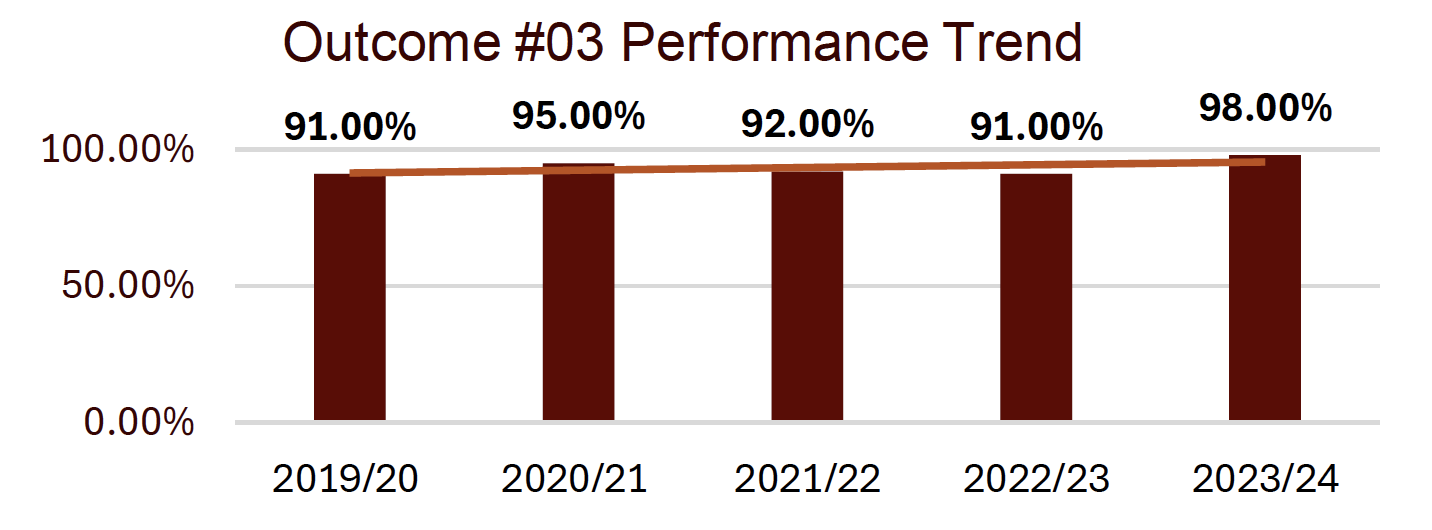
Outcome #3
- Approach (DEFINE): Graduates will demonstrate knowledge of and experience with the marketing planning process and experience with data analysis for decision making purposes.
- Deployment (MEASURE) - Direct, Formative, Internal: Class average score of Exam 2 which focused marketing data analysis >/= 80% for MKTG494
- Results (ANALYZE) - Activity Scores:
- 2019/20 was 91%
- 2020/21 was 95%
- 2021/22 was 92%
- 2022/23 was 91%
- 2023/24 was 100%
- Analysis of Results (INTERPRET/ANALYZE): The goal for Outcome #3 has been met. The class averaged 100% on their Google Analytics GA4 Certification and successfully integrated web analytics into their research project analysis.
- Action Taken/Improvement Made (IMPROVE): Three areas where outcomes could
be improved are:- 1) Incorporation of Responsible Use of AI;
- 2)Teaching students how to weave research findings in amongst business results; and
- 3) Make actionable recommendations for the business reviewing the research.
- Graph of Trends (CONTROL)
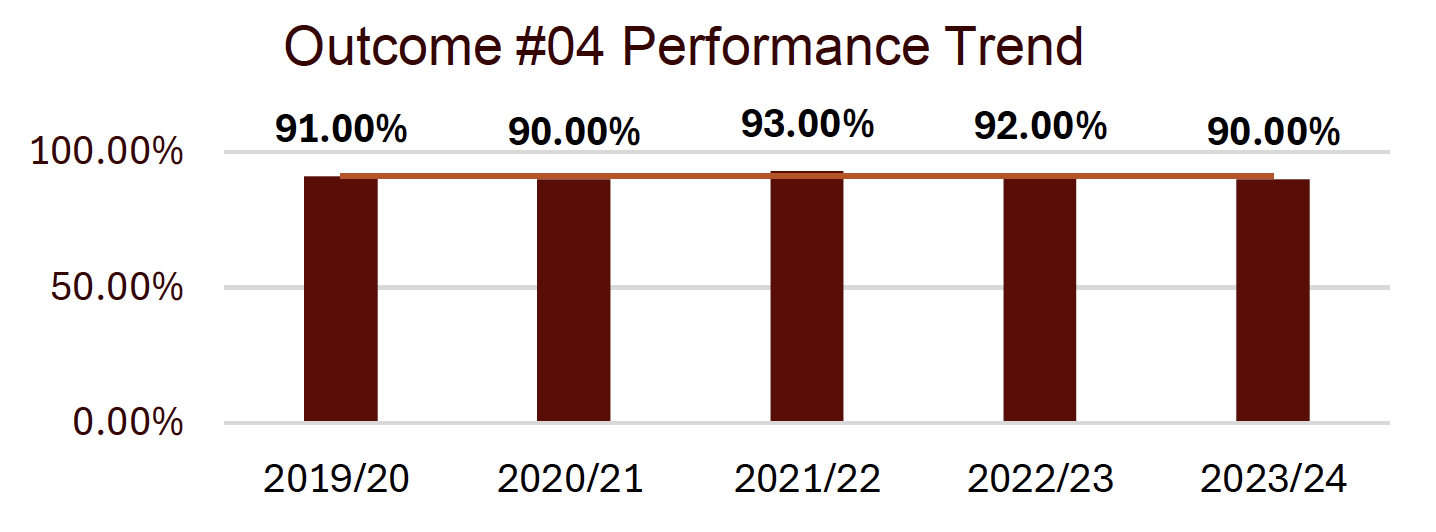
Outcome #4
- Approach (DEFINE): Graduates will show evidence of the ability to apply marketing theory in solving practical marketing problems.
- Deployment (MEASURE) - Direct, Formative, Internal: Overall class average percent on the Marketing Research Projects (Group) >/= 80% for MKTG494
- Results (ANALYZE) - Activity Scores:
- 2019/20 was 91%
- 2020/21 was 90.%
- 2021/22 was 93%
- 2022/23 was 92%
- 2023/24 was 90%
- Analysis of Results (INTERPRET/ANALYZE): The Market Research Project included defining a business problem/question, conducting the research, analyzing the research and comparing it to web analytics, closing with a presentation of findings.
- Action Taken/Improvement Made (IMPROVE): With the recent incorporation of the Google business analytics (GA4) certifications, the students can learn how to apply their analysis to specific business platforms like the performance of websites, email campaigns, and digital campaigns in conjunction with the market research they conducted.
- Graph of Trends (CONTROL)
Outcome #5
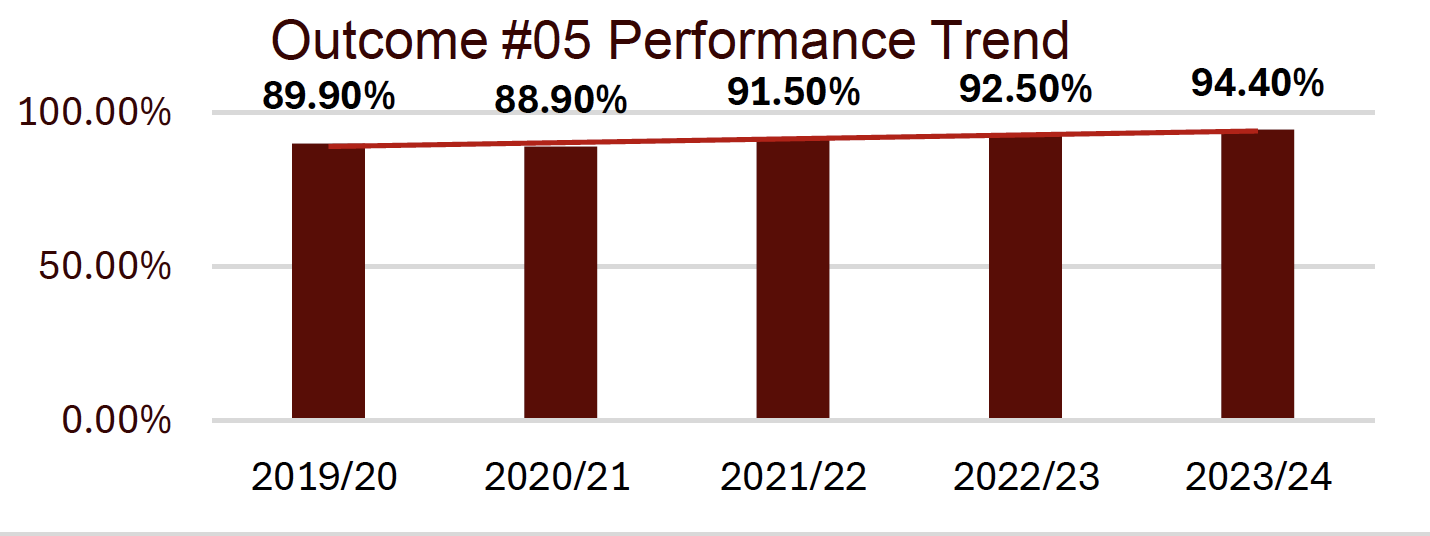
- Approach (DEFINE): Graduates will recognize political, legal, economical, and cultural forces which impact marketing around the world.
- Deployment (MEASURE) - Direct, Formative, Internal: Class averaged score of Exam 1 with a on the concepts and principles of marketing and international marketing >/= 80% for MKTG290; MKTG396
- Results (ANALYZE) - Activity Scores:
- 2019/20 was 89.9%
- 2020/21 was 88.9%
- 2021/22 was 91.5%
- 2022/23 was 92.5%
- 2023/24 was 94.4%
- Analysis of Results (INTERPRET/ANALYZE): There has been a gradual but steady improvement in results year over year.
- Action Taken/Improvement Made (IMPROVE): Continue existing strategy. Also, examine and if possible, incorporate student feedback on exams and other required evaluations and assessment of learning. Gradually incorporate AI tools especially in research projects and other curricular activities.
- Graph of Trends (CONTROL)
Outcome #1
- Approach (DEFINE): Graduates will demonstrate a working knowledge of the tools and terminology associated with manufacturing and service organizations.
- Deployment (MEASURE) - Direct, Formative, Internal:
- Midterm and Final Exams score for SCM 488 (> 70% Avg.). Project teams >80%
- > 10% of students achieve Green Belt Certification
- Results (ANALYZE) - Activity Scores:
- 2019/20 was 100%
- 2020/21 was 85%
- 2021/22 was 100%
- 2022/23 was 92%
- 2023/24 was 94%
- Analysis of Results (INTERPRET/ANALYZE): 94% of students enrolled in SCM 488 earned Enterprise Resource Planning SAP training & certification through an on-line course partnership with Michael Management.
- Action Taken/Improvement Made (IMPROVE): Improvements for 2024-2025: Client and external examiner rubric- has worked very well. Will develop peer evaluation rubric for students.
- Graph of Trends (CONTROL)
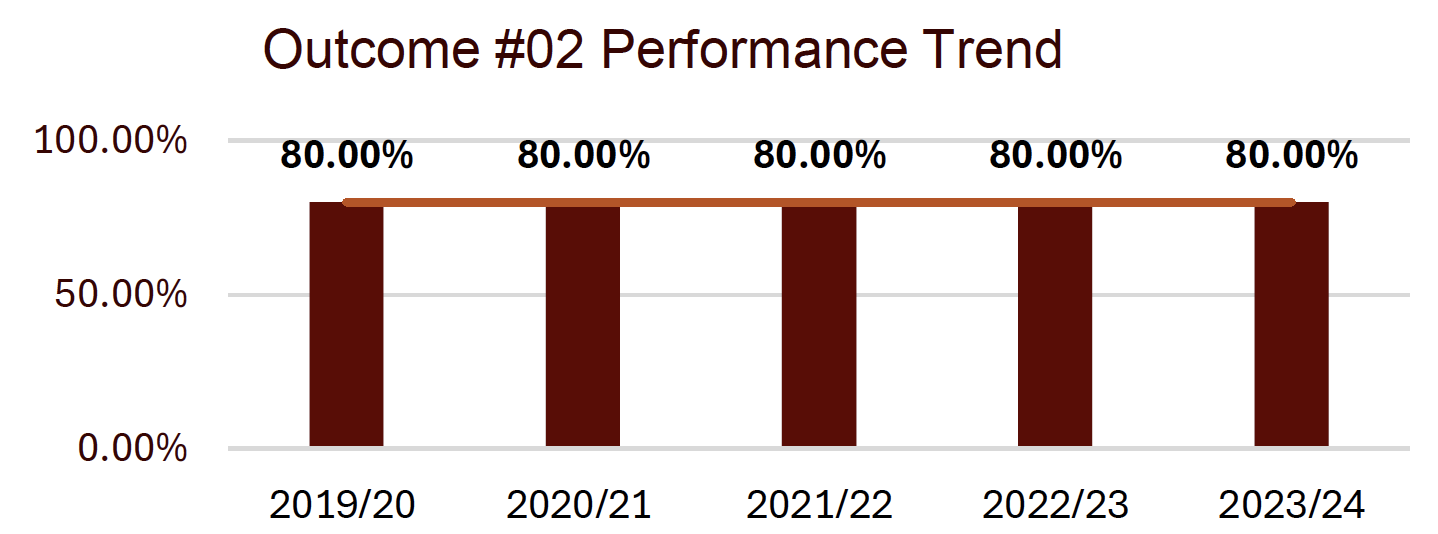
Outcome #2
- Approach (DEFINE): Graduates will demonstrate a working knowledge of distribution and logistics concepts, tools, and management practices.
- Deployment (MEASURE) - Direct, Formative, Internal: Exam score for SCM 485 (> 70% overall class average). All Applied Business Project teams >80% score as determined by external examiners.
- Results (ANALYZE) - Activity Scores:
- 2019/20 was 80%
- 2020/21 was 80%
- 2021/22 was 80%
- 2022/23 was 80%
- 2023/24 was 80%
- Analysis of Results (INTERPRET/ANALYZE): AY2023-2024 Results: In an ongoing effort to better link industry technology with course learning, all SCM 485 students performed logistics activities inside UIndy's 30,000 square foot Logistics lab. Project Completion Met.
- Action Taken/Improvement Made (IMPROVE): Improvements for 2024-2025: Client and external examiner rubric- based evaluation of student work has worked very well. Will develop peer evaluation rubric for students. Purpose is to identify if any students did not meet contribution expectations.
- Graph of Trends (CONTROL)
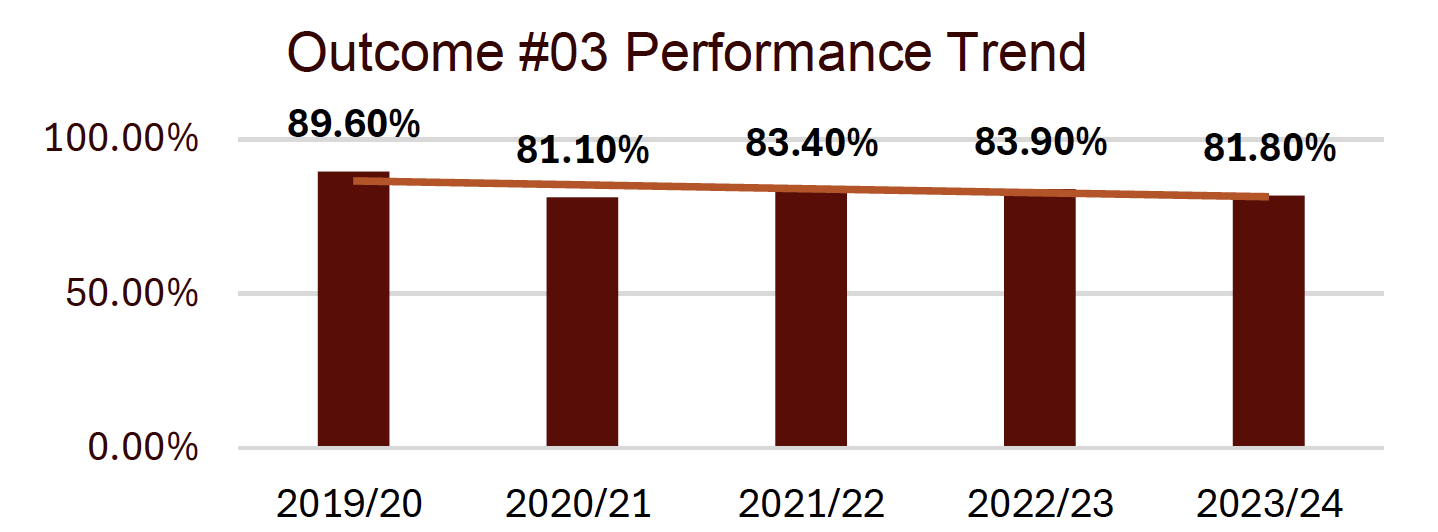
Outcome #3
- Approach (DEFINE): Graduates will demonstrate a working knowledge of project management terminology and management techniques.
- Deployment (MEASURE) - Direct, Formative, Internal: Final Exam score for SCM 404(> 70% overall class average)
- Results (ANALYZE) - Activity Scores:
- 2019/20 was 89.6%
- 2020/21 was 81.1%
- 2021/22 was 83.4%
- 2022/23 was 83.9%
- 2023/24 was 81.8%
- Analysis of Results (INTERPRET/ANALYZE): 2023-2024 assessment performance exceeded the goal coming in at 81.8%.
- Action Taken/Improvement Made (IMPROVE): Improvements for 2024-2025: Key professor was promoted to Dean. New instructor will be taking the course and redeveloping it based on previous feedback and student experiences
- Graph of Trends (CONTROL)
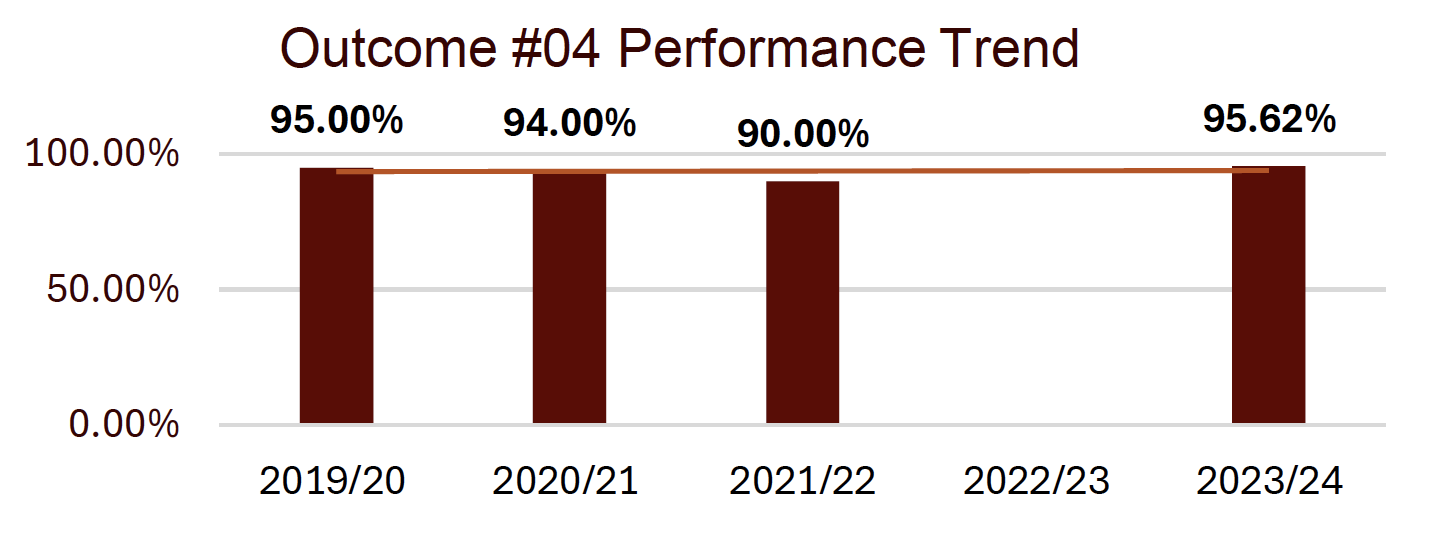
Outcome #4
- Approach (DEFINE): Graduates will demonstrate a working knowledge of quality management terminology, practices, and tools.
- Deployment (MEASURE) - Direct, Formative, Internal: SCM 405 Applied Business Project, Avg. 80%+ higher. 75% of the students pursue he Six Sigma Yellow Belt Certification achieve the Six Sigma Yellow Belt Certification
- Results (ANALYZE) - Activity Scores:
- 2019/20 was 95%
- 2020/21 was 94%
- 2021/22 was 90%
- 2022/23 No Data
- 2023/24 was 95.62%
- Analysis of Results (INTERPRET/ANALYZE):
- AY2023-2024 Results course average = 94.69% final exam average = 95.62% 19/21 passed internal yellow belt exam
- 21/21 passed internal ISO9001 exam
- Action Taken/Improvement Made (IMPROVE): Improvements for 2023-2024:
- 1) completion in class in mini boardroom-like settings to stimulate group critical thinking and problem- solving skills.
- 2) Mid-term individual paper/project to capture individual critical thinking and problem-solving skills
- Graph of Trends (CONTROL)
Outcome #5
- Approach (DEFINE): Graduates will demonstrate a working knowledge of purchasing and supplier relationship management terminology and practices.
- Deployment (MEASURE) - Direct, Formative, Internal: Midterm and Final Exams SCM 381 score (>70% combined average overall class)
- Results (ANALYZE) - Activity Scores:
- 2019/20 was 80%
- 2020/21 was 85%
- 2021/22 No Data
- 2022/23 was 91%
- 2023/24 was 91.5%
- Analysis of Results (INTERPRET/ANALYZE): 2023-2024: Performance exceeded the goal for semester 1 with an average of 88% and semester 2 at 95%.
- Action Taken/Improvement Made (IMPROVE): Improvements for AY2023-2024:
- 1) Completion in class in mini boardroom-like settings to stimulate group critical thinking and problem- solving skills.
- 2) Mid-term individual paper/project.
- 3) additional text materials procured as sources for diverse case studies
- Graph of Trends (CONTROL)
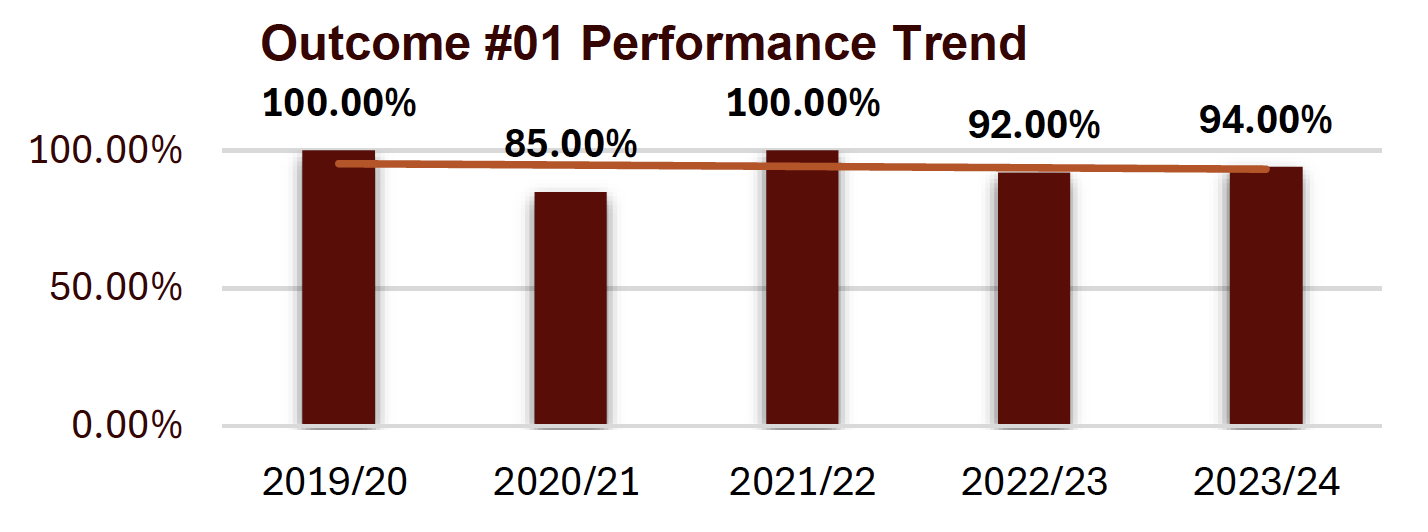
Outcome #1
- Approach (DEFINE): Graduates will explain and apply the concepts of project management.
- Deployment (MEASURE) - Direct, Formative, Internal: Final Exam score for SCM 404 (> 70% overall class average).
- Results (ANALYZE) - Activity Scores:
- 2019/20 was 89.6 %
- 2020/21 was 81.1%
- 2021/22 was 96%
- 2022/23 was 87.65%
- 2023/24 was 85.48%
- Analysis of Results (INTERPRET/ANALYZE):
- AY2022-2023 Results: Class average improved from 81% to 87.65%.
- AY2023-2024 Results: Class average 85.48
- Action Taken/Improvement Made (IMPROVE): AY2024-2025 Improvement Plan: Continue with current course strategy and evaluate at the conclusion of the 2024-25 academic year
- Graph of Trends (CONTROL)
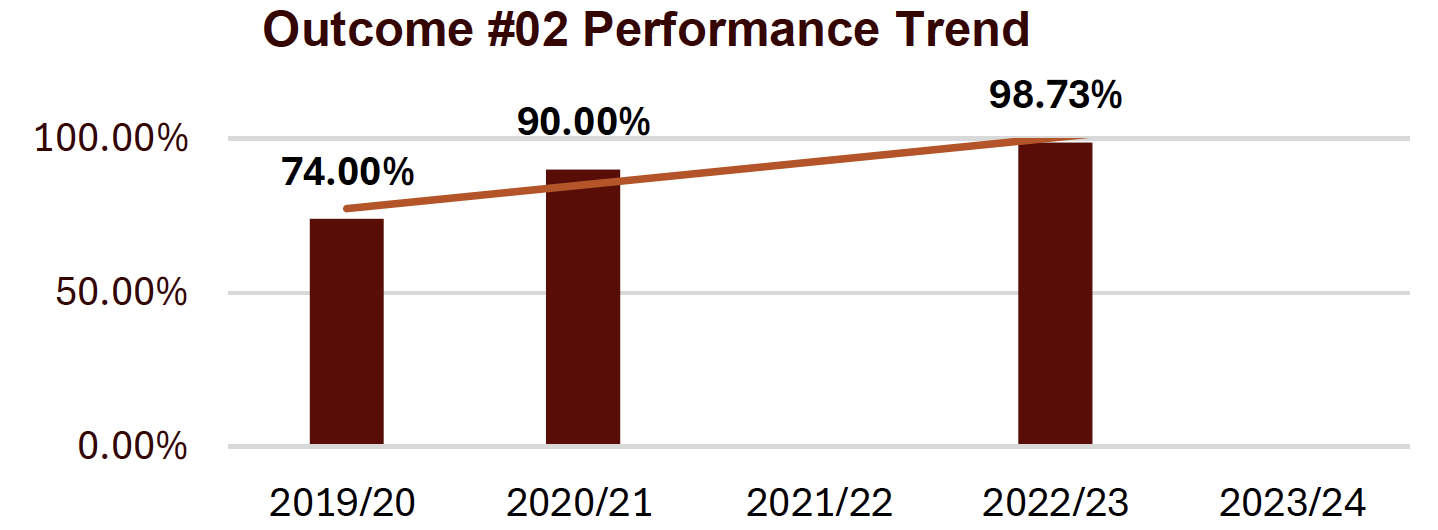
Outcome #2
- Approach (DEFINE): Graduates will demonstrate the application current theories and models of leadership in organizational leadership.
- Deployment (MEASURE) - Direct, Formative, Internal: Final Exam score for ORGL 302 (70%) overall class average.
- Results (ANALYZE) - Activity Scores:
- 2019/20 was 74%
- 2020/21 was 90%
- 2021/22 No Data
- 2022/23 was 98.73%
- 2023/24 No Data
- Analysis of Results (INTERPRET/ANALYZE):
- AY2022-2023 Results: Class average is 98.73%
- AY2023-2024 Results: Enrollment is three students, no data is available.
- Action Taken/Improvement Made (IMPROVE): AY2024-2025 Improvement Plan: Continue with current course strategy and evaluate at the conclusion of the 2024-25 academic year. Implement plans to increase course enrollment.
- Graph of Trends (CONTROL)
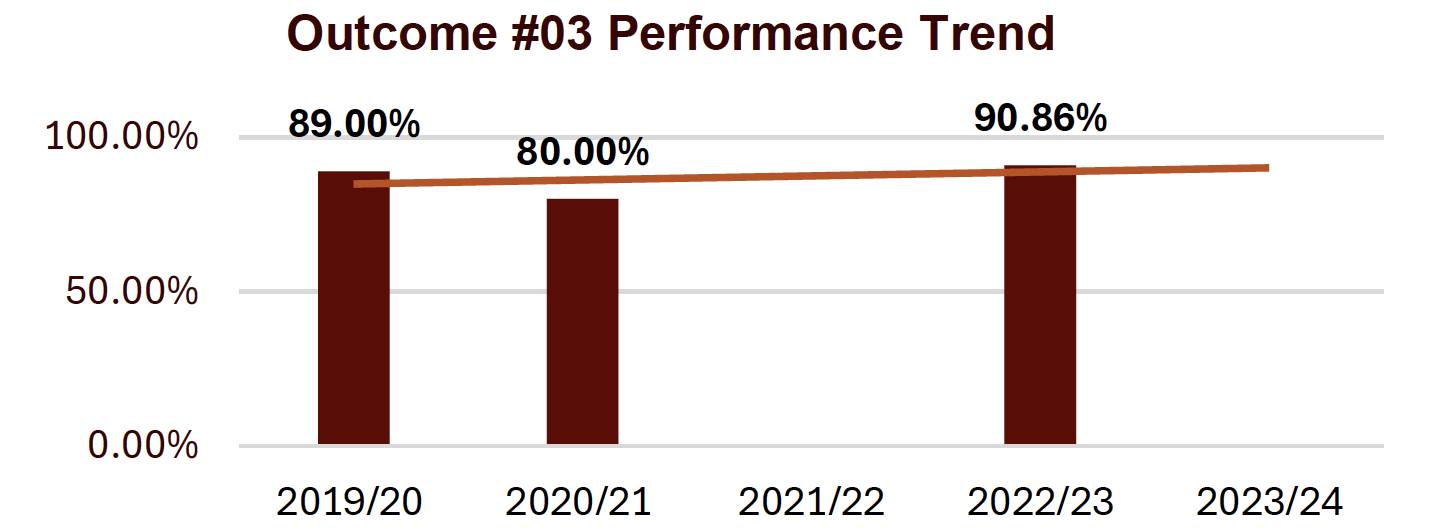
Outcome #3
- Approach (DEFINE): Graduates will apply insights on personal and group behaviors to ethical leadership in an organization.
- Deployment (MEASURE) - Direct, Formative, Internal: Seventy percent (70%) or better class average score on final Case Study Assignment for ORGL 304.
- Results (ANALYZE) - Activity Scores:
- 2019/20 was 89%
- 2020/21 was 80%
- 2021/22 No Data
- 2022/23 was 90.86%
- 2023/24 No Data
- Analysis of Results (INTERPRET/ANALYZE):
- AY2022-2023 Results: Class average is 90.86%
- AY2023-2024 Results: Enrollment is three students, no data is available.
- Action Taken/Improvement Made (IMPROVE): AY2024-2025 Improvement Plan: Continue with current course strategy and evaluate at the conclusion of the 2024-25 academic year. Implement plans to increase course enrollment.
- Graph of Trends (CONTROL)
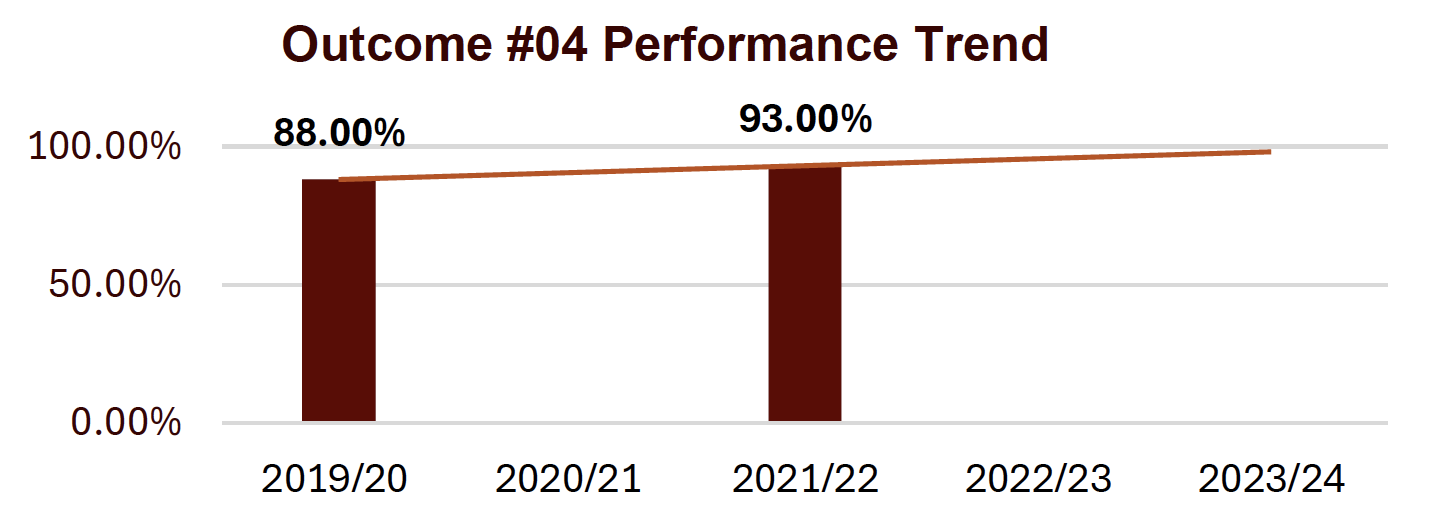
Outcome #4
- Approach (DEFINE): Graduates will demonstrate the different stages of change management.
- Deployment (MEASURE) - Direct, Formative, Internal: Seventy percent (70%) or better class average of total points of final research papers in ORGL 406.
- Results (ANALYZE) - Activity Scores:
- 2019/20 was 88%
- 2020/21 No Data
- 2021/22 was 93%
- 2022/23 No Data
- 2023/24 No Data
- Analysis of Results (INTERPRET/ANALYZE):
- The course outcome average was 93% in 2021
- AY2022-2023 Result: No Data Available
- AY2023-2024 Results: No Data
- Action Taken/Improvement Made (IMPROVE):
- Plan for AY2023-2024: Continue to increase emphasis on concepts of Ethical Challenges and Ethical Crisis in Leadership related to current news.
- AY2024-2025 Improvement Plan: Continue with existing strategy
- Graph of Trends (CONTROL)
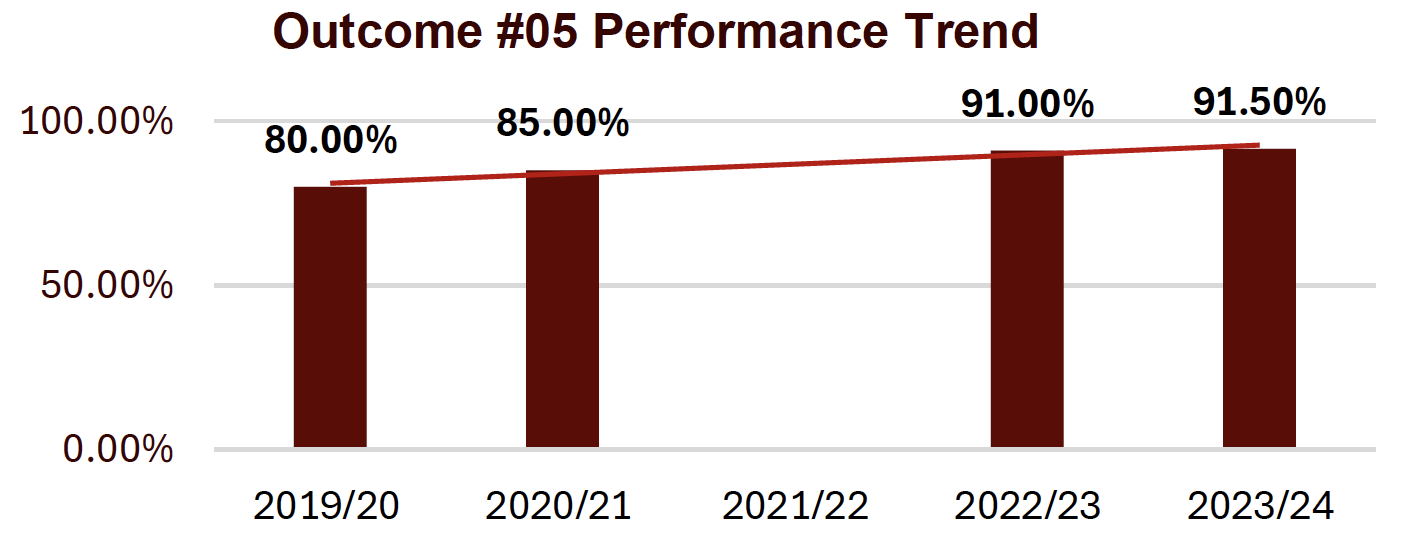
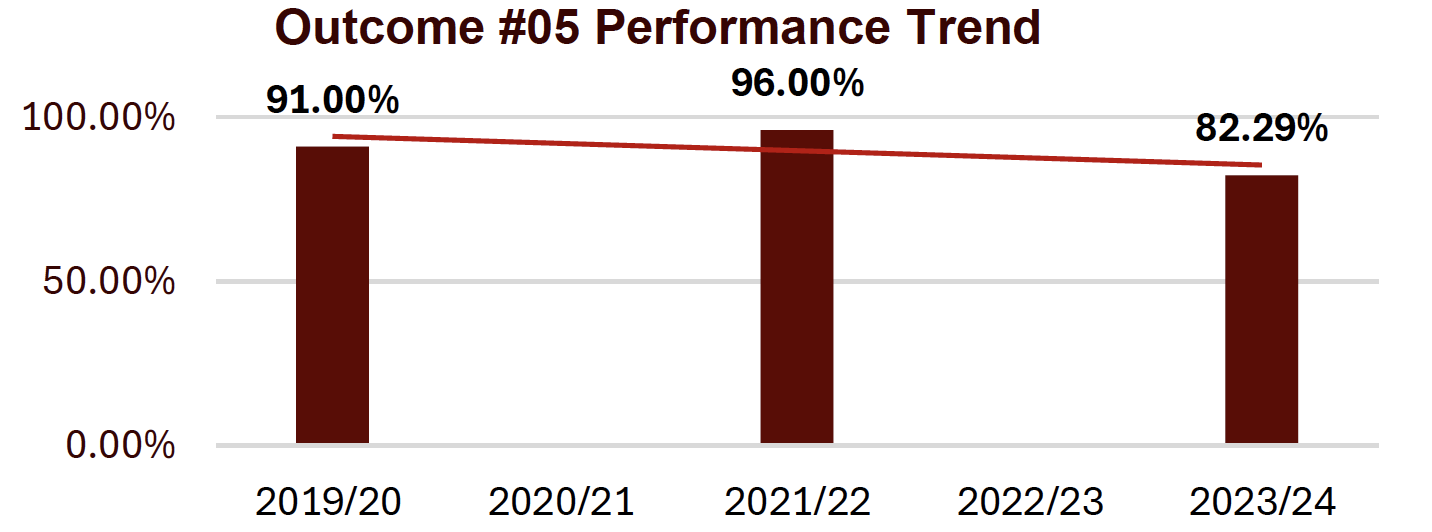
Outcome #5
- Approach (DEFINE): Graduates will demonstrate a working knowledge in the area of exemplary and/or authentic leadership.
- Deployment (MEASURE) - Direct, Formative, Internal: Seventy percent (70%) or better class average of total points on Final Presentation in ORGL 410.
- Results (ANALYZE) - Activity Scores:
- 2019/20 was 91%
- 2020/21 No Data
- 2021/22 was 96%
- 2022/23 No Data
- 2023/24 was 82.29%
- Analysis of Results (INTERPRET/ANALYZE):
- The course outcome average was 96% in 2021.
- AY2022-2023 Results: No Data Available
- AY2023-2024 Results: Class average is 82.29%
- Action Taken/Improvement Made (IMPROVE):
- Plan for AY2023-2024: Continue students feedback on assignments and provide additional opportunities for students to engage.
- AY2024-2025 Improvement Plan: Continue with existing strategy
- Graph of Trends (CONTROL)
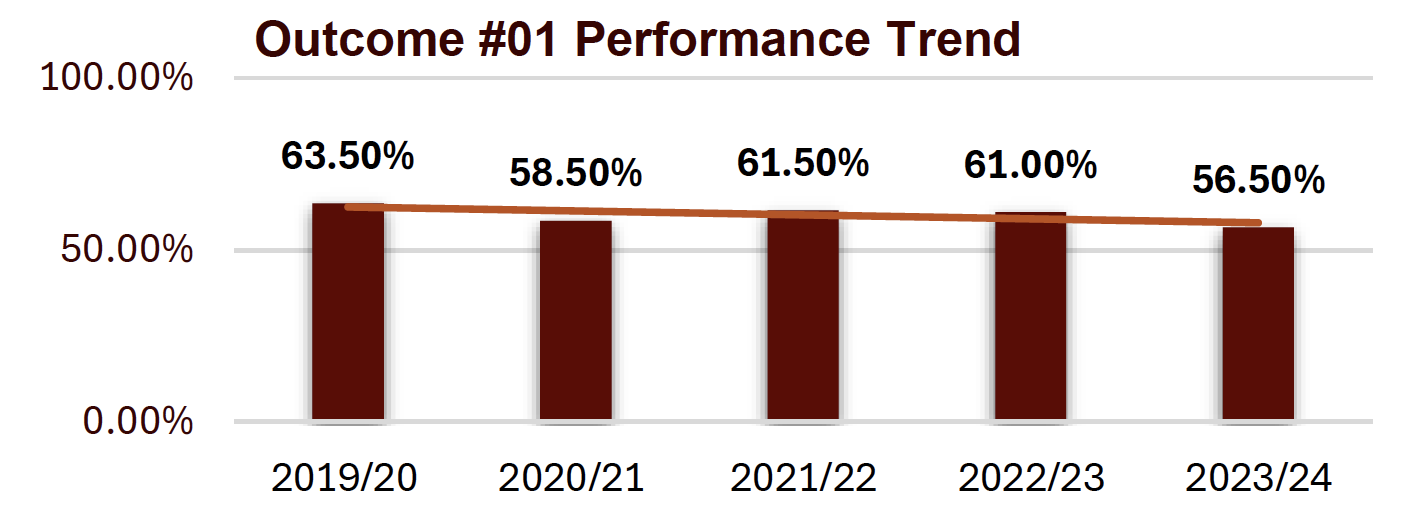
Outcome #1
- Approach (DEFINE): Graduates will perform ratio analysis, develop cash flow statements, and apply accounting principles to the management of organizations.
- Deployment (MEASURE) - Direct, Formative, Internal: Meet or exceed results of the Financial and Managerial Accounting Major Field Test average of all ACBSP schools.
- Results (ANALYZE) - Activity Scores:
- 2019/20 was 63.5%
- 2020/21 was 58.5%
- 2021/22 was 61.5%
- 2022/23 was 61%
- 2023/24 was 56.5%
- Analysis of Results (INTERPRET/ANALYZE):
- 2022-2023 Goal: Financial and Managerial Accounting portions of the exam of 61% for UIndy vs. 59.13% for all other ACBSP
- 2023-2024 Results: 56.5%
- Action Taken/Improvement Made (IMPROVE): All professors in the Accounting discipline should be provided with anticipated test topics to ensure they are covered in their course. Redesign course for improved student learning outcomes, established since Summer 2024.
- Graph of Trends (CONTROL)
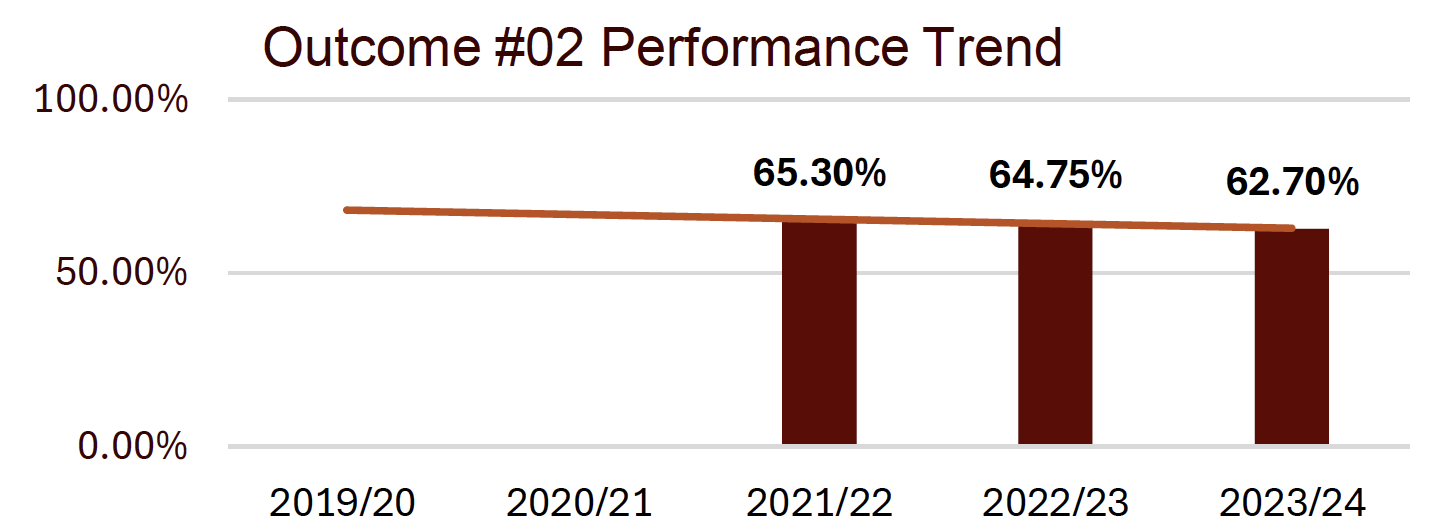
Outcome #2
- Approach (DEFINE): Graduates will explain and discuss the management and leadership of organizations.
- Deployment (MEASURE) - Direct, Formative, Internal: Meet or exceed results of the Management Major Field Test average of all ACBSP schools.
- Results (ANALYZE) - Activity Scores:
- 2019/20 No data
- 2020/21 No Data
- 2021/22 was 65.3%
- 2022/23 was 64.75%
- 2023/24 was 62.7%
- Analysis of Results (INTERPRET/ANALYZE):
- 2022-2023 Goal was not met. UIndy achieved a 64.75% Management portion of the exit exam vs. 66.75%.
- 2023-2024 Results: 62.7%
- Action Taken/Improvement Made (IMPROVE): Courses that are deficient in quality and content should be redesigned; this process has been ongoing from Summer 2024, and will conclude in Fall 2025.
- Graph of Trends (CONTROL)
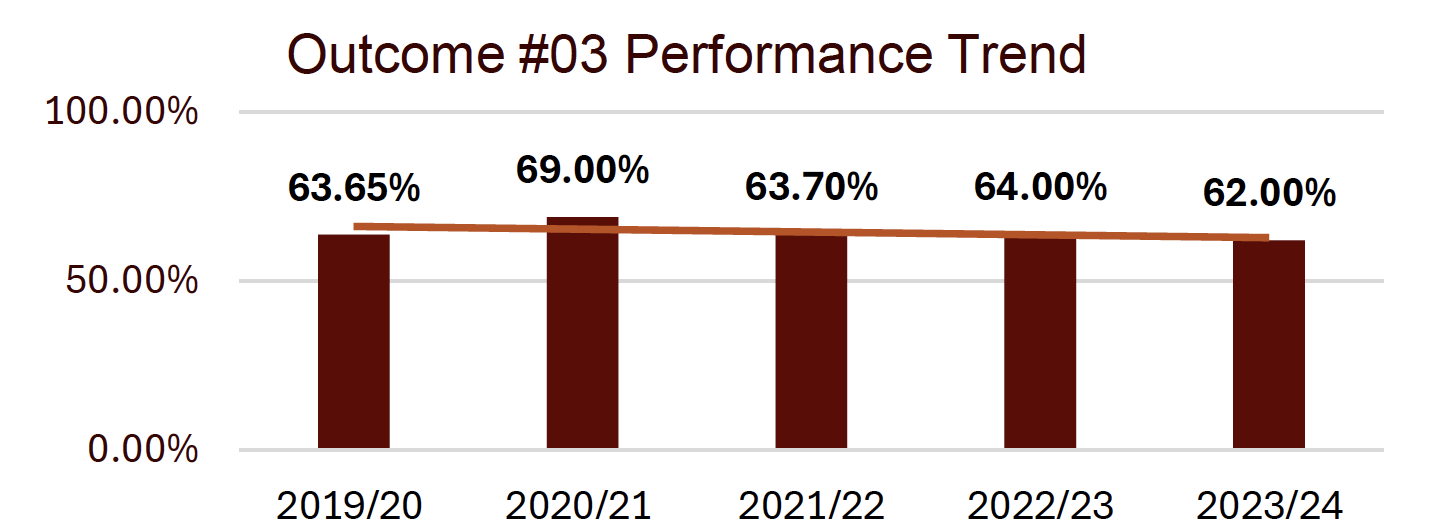
Outcome #3
- Approach (DEFINE): Graduates will demonstrate knowledge of Marketing plans, market segmentation, 4 Ps and distribution.
- Deployment (MEASURE) - Direct, Formative, Internal: Meet or exceed results of the Marketing Major Field Test average of all ACBSP schools.
- Results (ANALYZE) - Activity Scores:
- 2019/20 was 63.65%
- 2020/21 was 69%
- 2021/22 was 63.7%
- 2022/23 was 64%
- 2023/24 was 62%
- Analysis of Results (INTERPRET/ANALYZE):
- 2022-2023 Goal not met with a 64% UINDY average on the Marketing portion of the exit exam versus an average of 64.75%.
- 2023-2024 Results: 62.0%
- Action Taken/Improvement Made (IMPROVE): Courses that are deficient in quality and content should be redesigned; this process has been ongoing from Summer 2024, and will conclude in Fall 2025.
- Graph of Trends (CONTROL)
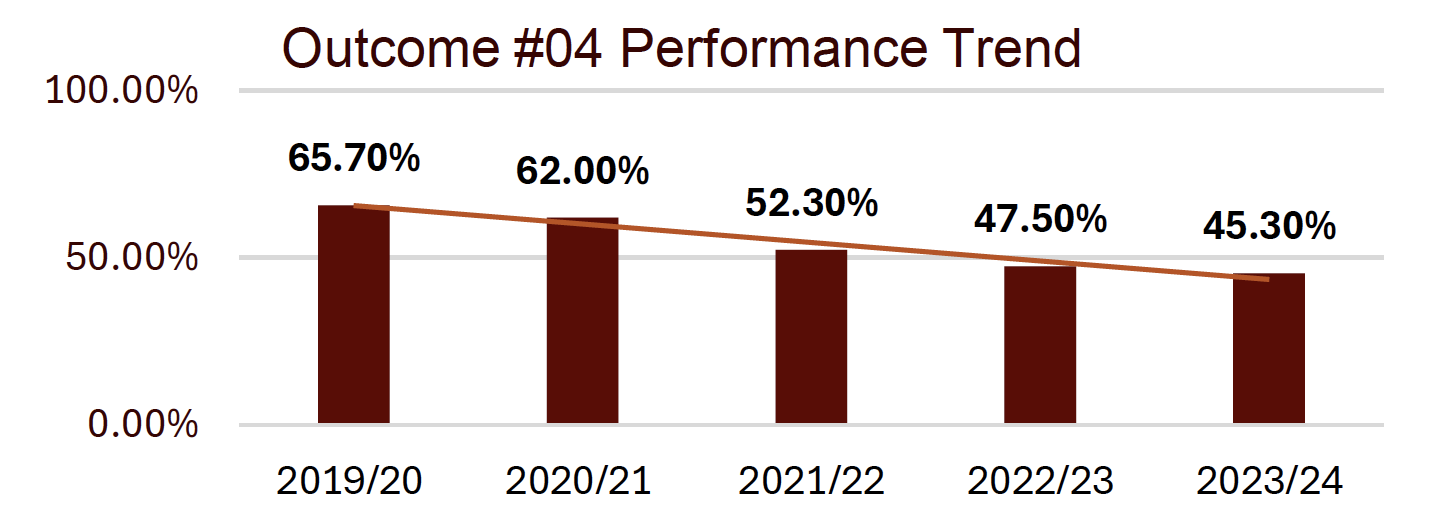
Outcome #4
- Approach (DEFINE): Graduates will discuss Porter’s 5 forces in the development of strategic plans, and implementation in an environment of change.
- Deployment (MEASURE) - Direct, Formative, Internal: Meet or exceed results of the Strategy Major Field Test average of all ACBSP schools.
- Results (ANALYZE) - Activity Scores:
- 2019/20 was 65.7%
- 2020/21 was 62%
- 2021/22 was 52.3%
- 2022/23 was 47.5%
- 2023/24 was 45.3%
- Analysis of Results (INTERPRET/ANALYZE):
- 2022-2023 Not met with a 47.5% UINDY average on the Strategic Management portion of the exit exam versus an average of 51.5%.
- 2023-2024 Results: Enter the results here: 45.3%
- Action Taken/Improvement Made (IMPROVE): Courses that are deficient in quality and content should be redesigned; this process has been ongoing from Summer 2024, and will conclude in Fall 2025.
- Graph of Trends (CONTROL)
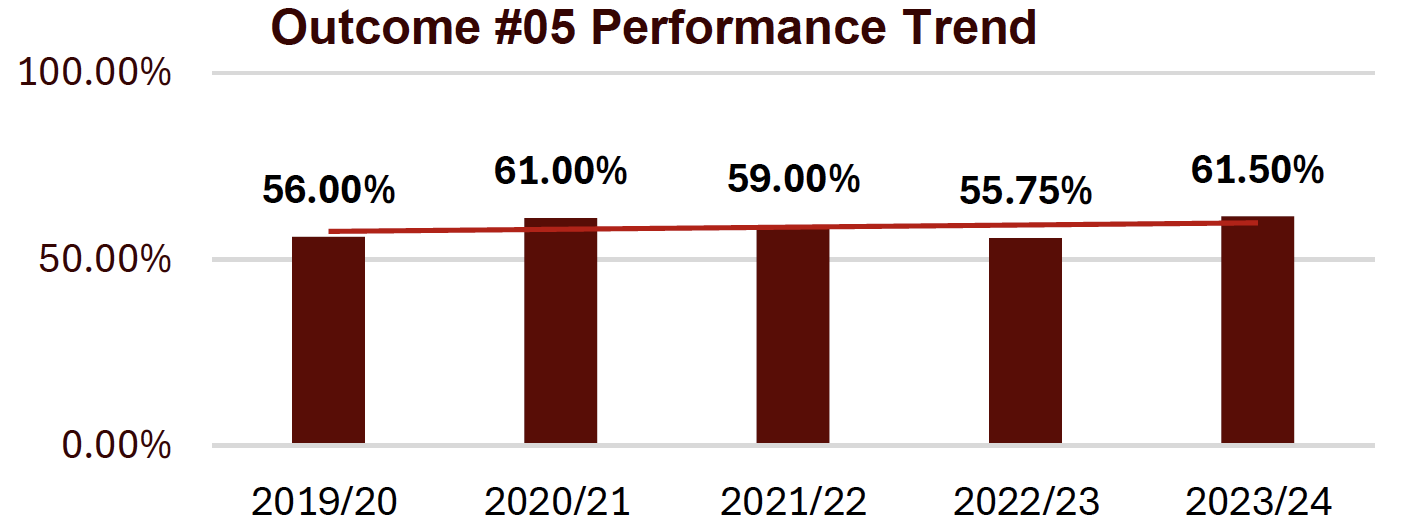
Outcome #5
- Approach (DEFINE): Graduates will explain how capital markets functions and be able to apply analysis to a valuation of assets and capital structure.
- Deployment (MEASURE) - Direct, Formative, Internal: Meet or exceed results of the Corporate Finance Major Field Test average of all ACBSP schools.
- Results (ANALYZE) - Activity Scores:
- 2019/20 was 56%
- 2020/21 was 61%
- 2021/22 was 59%
- 2022/23 was 55.75%
- 2023/24 was 61.5%
- Analysis of Results (INTERPRET/ANALYZE):
- 2022-2023 Goal was not met with a 55.75% on the Corporate Finance portion of the exit exam versus an average of 62.25%.
- 2023-2024 Results: 61.5%
- Action Taken/Improvement Made (IMPROVE): Courses that are deficient in quality and content should be redesigned; this process has been ongoing from Summer 2024, and will conclude in Fall 2025.
- Graph of Trends (CONTROL)
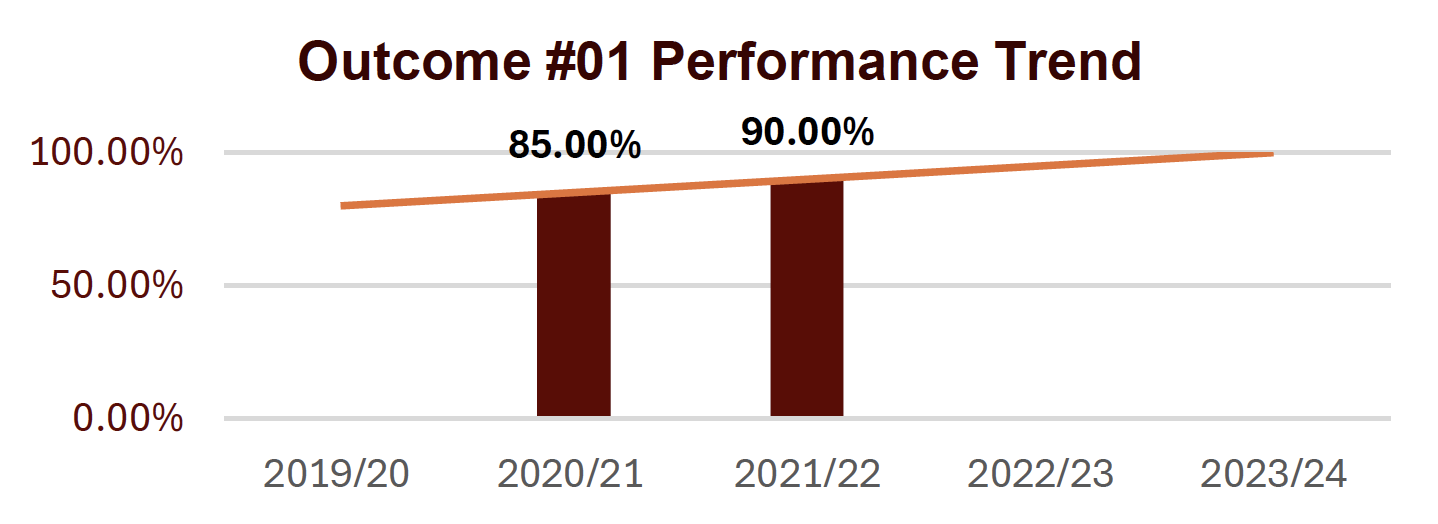
Outcome #1
- Approach (DEFINE): Graduates will apply the CRISP-DM analytics methodology to an analytics project.
- Deployment (MEASURE) - Direct, Formative, Internal: Meet or exceed a value of 85% for the Final Report created over the semester. Major project in the MSDA 616 Business Analytics class.
- Results (ANALYZE) - Activity Scores:
- 2019/20 No Data
- 2020/21 was 85%
- 2021/22 was 90%
- 2022/23 No Data
- 2023/24 No Data
- Analysis of Results (INTERPRET/ANALYZE): Insufficient Data Reported
- Action Taken/Improvement Made (IMPROVE): Insufficient Data Reported
- Graph of Trends (CONTROL)
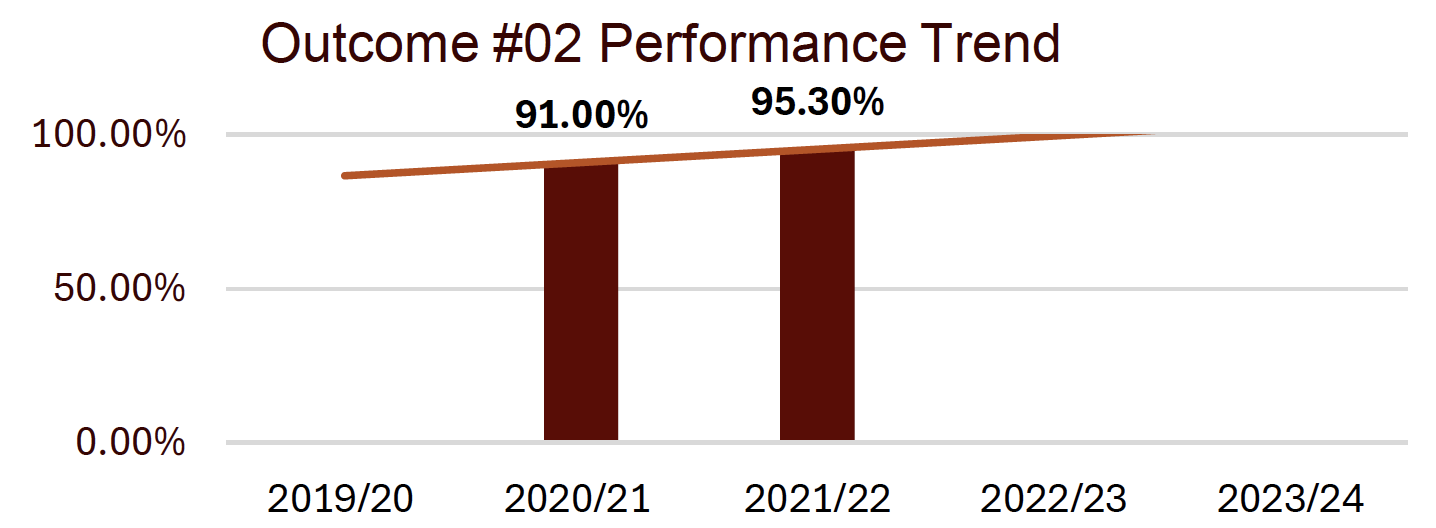
Outcome #2
- Approach (DEFINE): Graduates will perform and interpret the results from a non-technical perspective for a predictive analytics project.
- Deployment (MEASURE) - Direct, Formative, Internal: Meet or exceed a value of 85% for the Final Project submittal created over the semester. Analytics project in the MSDA 617 Predictive Analytics class.
- Results (ANALYZE) - Activity Scores:
- 2019/20 No Data
- 2020/21 was 91%
- 2021/22 was 95.3%
- 2022/23 No Data
- 2023/24 No Data
- Analysis of Results (INTERPRET/ANALYZE): Insufficient Data Reported
- Action Taken/Improvement Made (IMPROVE): Insufficient Data Reported
- Graph of Trends (CONTROL)
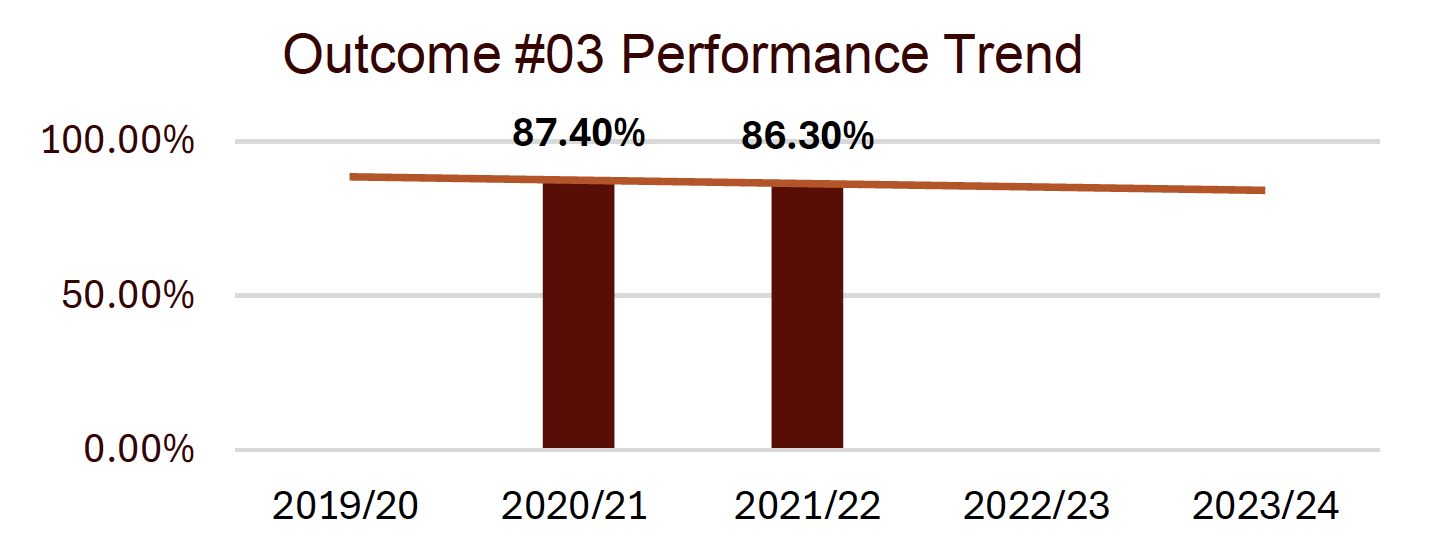
Outcome #3
- Approach (DEFINE): Graduates will apply the concepts of Forensics Text Analytics to an unstructured data set.
- Deployment (MEASURE) - Direct, Formative, Internal: Meet or exceed a value of 85% for the Forensics Text Analytics. Forensics project in the MSDA 618 Unstructured Data Analytics class.
- Results (ANALYZE) - Activity Scores:
- 2019/20 No Data
- 2020/21 was 87.4%
- 2021/22 was 86.3%
- 2022/23 No Data
- 2023/24 No Data
- Analysis of Results (INTERPRET/ANALYZE): Insufficient Data Reported
- Action Taken/Improvement Made (IMPROVE): Insufficient Data Reported
- Graph of Trends (CONTROL)
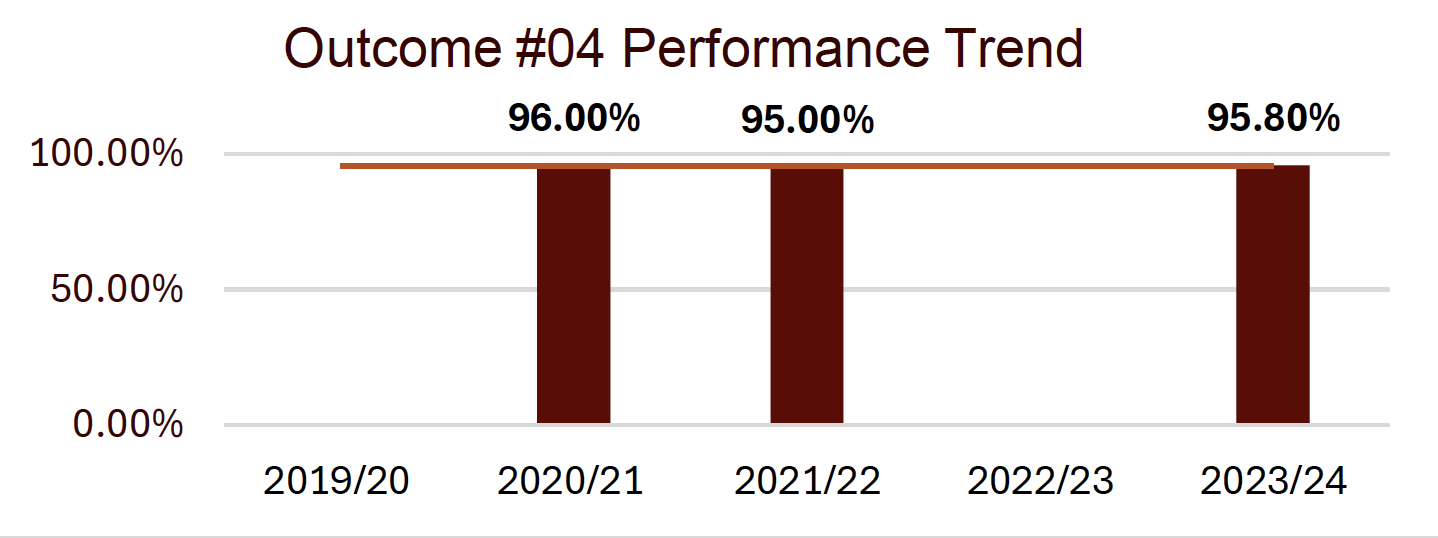
Outcome #4
- Approach (DEFINE): Graduates will apply the concepts of database design and write SQL code to extract data from a database.
- Deployment (MEASURE) - Direct, Formative, Internal: Meet or exceed a value of 85% for the final exam in the class. Exams in MSDA 619 Database Management and SQL.
- Results (ANALYZE) - Activity Scores:
- 2019/20 No Data
- 2020/21 was 96%
- 2021/22 was 95%
- 2022/23 No Data
- 2023/24 was 95.8%
- Analysis of Results (INTERPRET/ANALYZE): Insufficient Data Reported
- Action Taken/Improvement Made (IMPROVE): Insufficient Data Reported
- Graph of Trends (CONTROL)
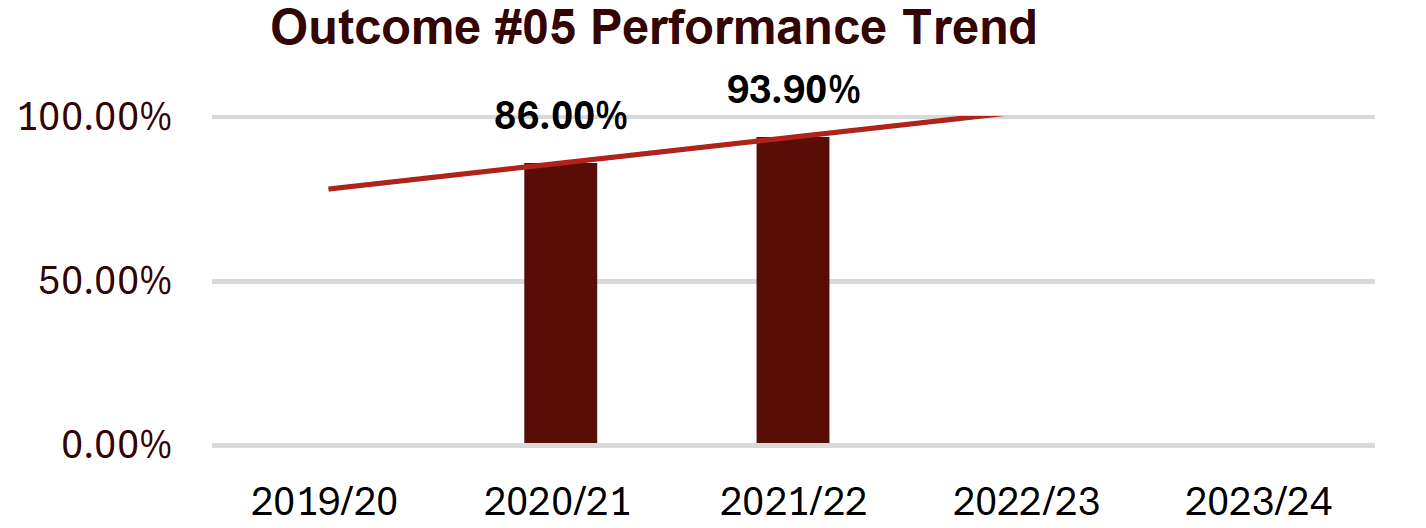
Outcome #5
- Approach (DEFINE): Graduates will apply the theories, methods, and tools used in an analytics project.
- Deployment (MEASURE) - Direct, Formative, Internal: Meet or exceed a value of 85% for the Academic Reflection Paper in the class. Major paper in MSDA 624 Analytics Capstone.
- Results (ANALYZE) - Activity Scores:
- 2019/20 No Data]
- 2020/21 was 86%
- 2021/22 was 93.9%
- 2022/23 No Data
- 2023/24 No Data
- Analysis of Results (INTERPRET/ANALYZE): Insufficient Data Reported
- Action Taken/Improvement Made (IMPROVE): Insufficient Data Reported
- Graph of Trends (CONTROL)
Outcome #1
- Approach (DEFINE): Graduates will explain and apply the model of reciprocity and exchange.
- Deployment (MEASURE) - Direct, Formative, Internal: An average of 90% or better on the Art of Give and Take assignment applying the Cohen- Bradford model of reciprocity to a real situation.
- Results (ANALYZE) - Activity Scores:
- 2019/20 was 94%
- 2020/21 was 91%
- 2021/22 was 98%
- 2022/23 was 91.9%
- 2023/24 No Data
- Analysis of Results (INTERPRET/ANALYZE): AY2022-2023 Results: The average of all student scores on the Art of Give and Take Assignment was 91.9%, exceeding the 90% goal.
- Action Taken/Improvement Made (IMPROVE): The rubric for the assessment will be modified to further delineate the assessment of each step in the Cohen-Bradford model of reciprocity.
- Graph of Trends (CONTROL)
Outcome #2
- Approach (DEFINE): Graduates will demonstrate knowledge of financial terminology, principles, and analytical tools used to make sound financial decisions in order to improve the performance of the firm.
- Deployment (MEASURE) - Direct, Formative, Internal: Target average score of 75% on the mid-term and final exam in Principles of Financial Management course.
- Results (ANALYZE) - Activity Scores:
- 2019/20 No Data
- 2020/21 was 88%
- 2021/22 was 93%
- 2022/23 was 100%
- 2023/24 No Data
- Analysis of Results (INTERPRET/ANALYZE): AY2022-2023 Results: 100% (The course only had 8 people enrolled this year, all from the SLAM program, and it was modified to focus on the SLAM students).
- Action Taken/Improvement Made (IMPROVE): The new course instructor had some kinks to work out but things appear to be moving forward based on student feedback.
- Graph of Trends (CONTROL)
Outcome #3
- Approach (DEFINE): Graduates will Describe how core areas of Human Resource Management are implemented: people resourcing; performance management; rewards; learning and development; and employee relations.
- Deployment (MEASURE) - Direct, Formative, Internal: An average score of 90% or better on the final exam.
- Results (ANALYZE) - Activity Scores:
- 2019/20 No Data
- 2020/21 was 83%
- 2021/22 was 84%
- 2022/23 was 93%
- 2023/24 No Data
- Analysis of Results (INTERPRET/ANALYZE): AY2022-2023 Results: The MSM program was redesigned, certain courses were eliminated from the
program. The average of all student scores on the final exam was 93.2%, exceeding the target of 90%. - Action Taken/Improvement Made (IMPROVE): Further develop the assessment of key human resource management outcomes.
- Graph of Trends (CONTROL)
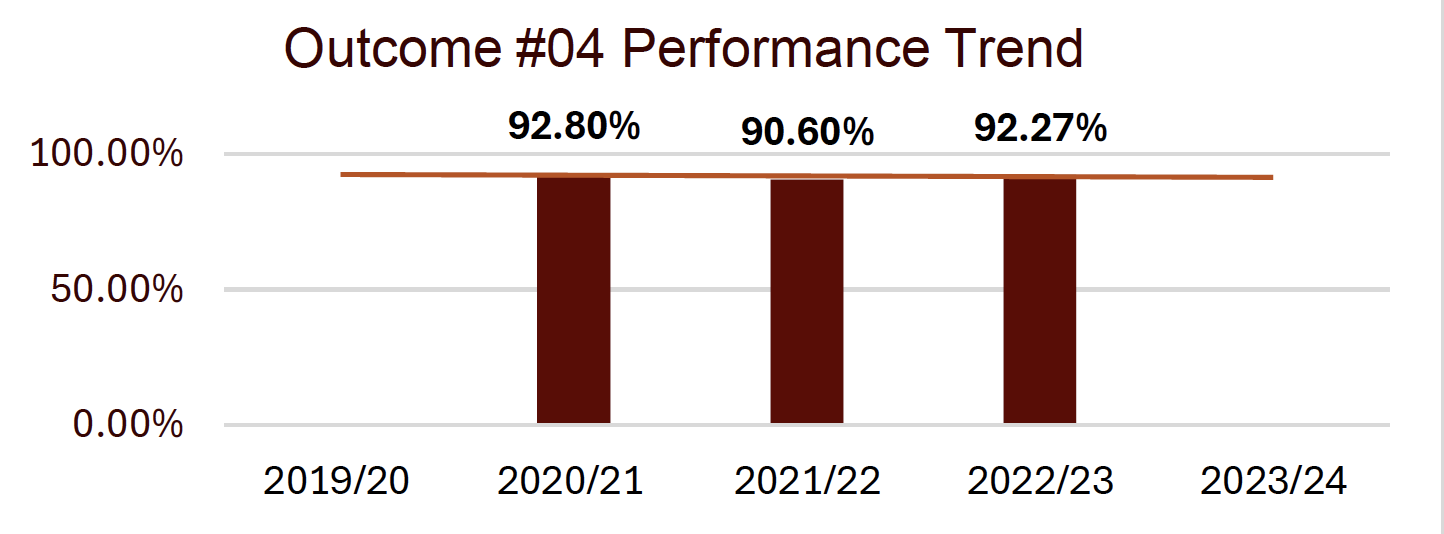
Outcome #4
- Approach (DEFINE): Graduates will define and explain the basic concepts and terms of project management.
- Deployment (MEASURE) - Direct, Formative, Internal: The Final Exam is a comprehensive evaluation of the key topics for the course. Successful learning is deemed 80% or better average for the Final Exam.
- Results (ANALYZE) - Activity Scores:
- 2019/20 No Data
- 2020/21 was 92.8%
- 2021/22 was 90.6%
- 2022/23 was 92.27%
- 2023/24 No Data
- Analysis of Results (INTERPRET/ANALYZE): AY2022-2023 Results: The average final grade for all sections was 92.27, a significant increase over the previous year but aligned with 2020-2021.
- Action Taken/Improvement Made (IMPROVE): MSM558 has been merged into MBA615 which will is now being offered to all graduate students. MSM students will benefit because the MBA615 course is an executive- level course that also uses applied learning.
- Graph of Trends (CONTROL)
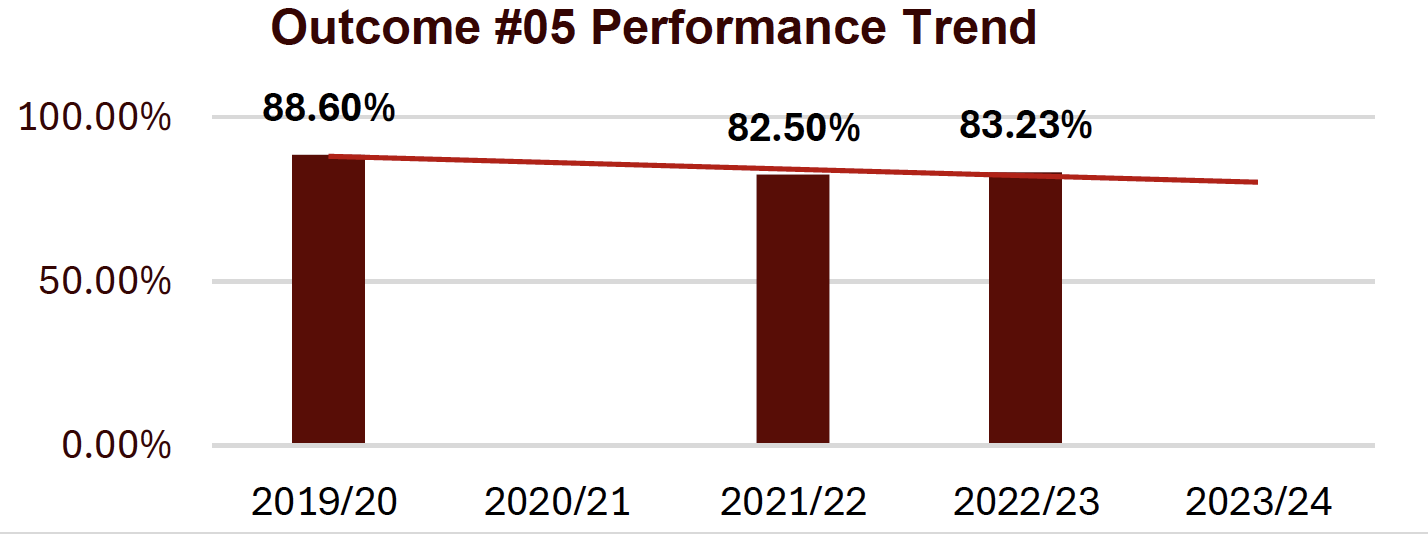
Outcome #5
- Approach (DEFINE): Graduates will explain the critical importance of operations and supply chain to all businesses and clearly distinguish the competitive.
- Deployment (MEASURE) - Direct, Formative, Internal: Final exam is a complete summative evaluation of the knowledge and skills gained in operations management. A target average of 80% is the goal.
- Results (ANALYZE) - Activity Scores:
- 2019/20 was 88.6%
- 2020/21 No Data
- 2021/22 was 82.5%
- 2022/23 was 83.23%
- 2023/24 No Data
- Analysis of Results (INTERPRET/ANALYZE):
- The 2020-2021 identified improvement strategy will be continued.
- AY2021-2022: 82.5%
- AY2022-2023 Results: Exceeded target metric with 83.23%.
- Action Taken/Improvement Made (IMPROVE): Revision to the forecasting module will be made to improve quality and focus more on a single more advanced technique rather than the breadth approach previously used.
- Graph of Trends (CONTROL)
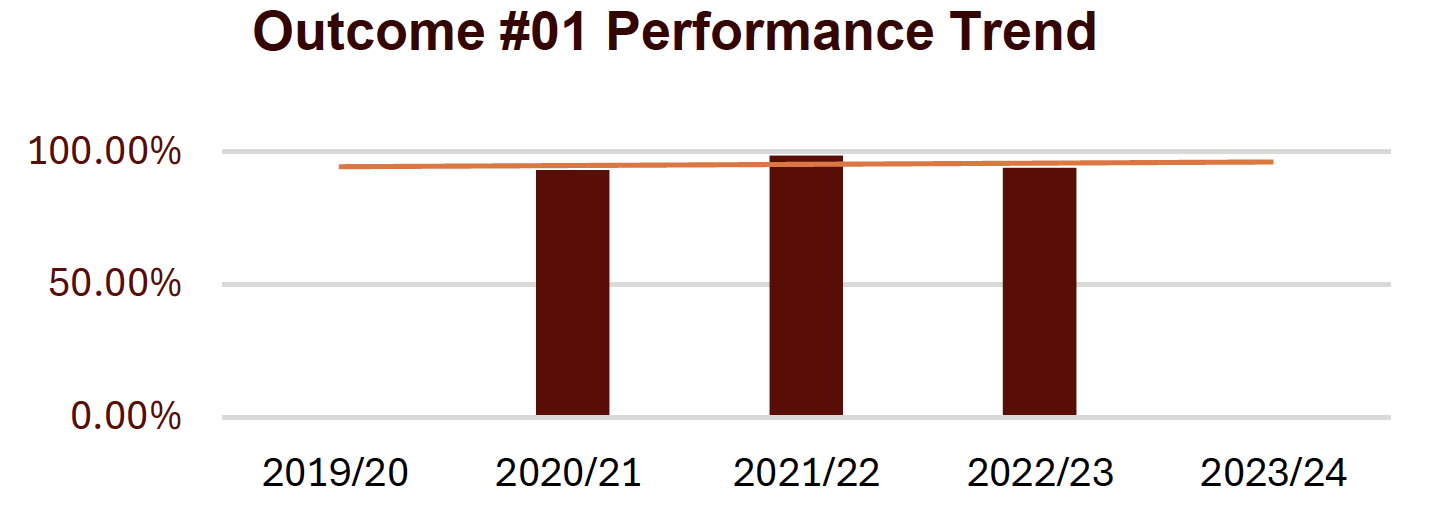
Outcome #1
- Approach (DEFINE): Graduates will demonstrate knowledge to explain systems within organizations from an operational perspective and investigate strategic design as it relates to these systems.
- Deployment (MEASURE) - Direct, Formative, Internal: The goal of eighty percent (80%) or better of total points on Final Learning Model. SLD510
- Results (ANALYZE) - Activity Scores:
- 2019/20 No data
- 2020/21 was 93.1%
- 2021/22 was 98.57%
- 2022/23 was 94%
- 2023/24 No Data
- Analysis of Results (INTERPRET/ANALYZE): AY2023-2024 Results: No results available for this outcome.
- Action Taken/Improvement Made (IMPROVE): AY2024-2025: Maintain current strategy. This course is currently active; the program will no longer be offered effective fall of 2025. Valuable components have been migrated to other graduate offerings in the school of business.
- Graph of Trends (CONTROL)
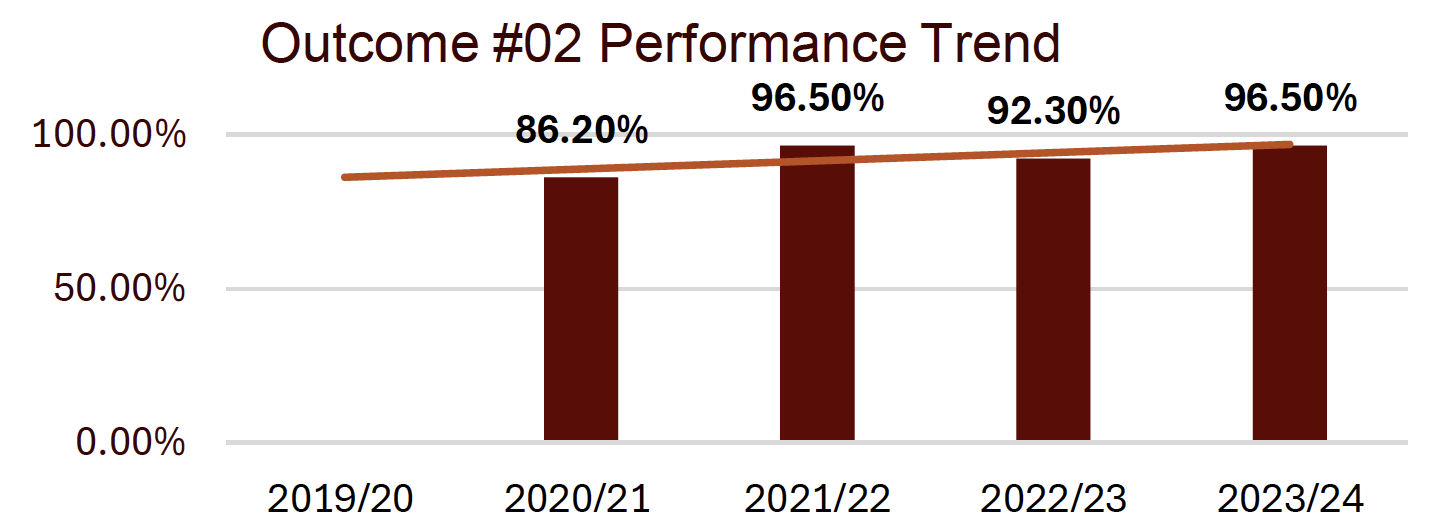
Outcome #2
- Approach (DEFINE): Graduates will demonstrate knowledge of cultural assessments to determine who to address change.
- Deployment (MEASURE) - Direct, Formative, Internal: The goal of eighty percent 80% or better on the Model Presentations and Group Assignments. SLD520
- Results (ANALYZE) - Activity Scores:
- 2019/20 No data
- 2020/21 was 86.2%
- 2021/22 was 96.5%
- 2022/23 was 92.3%
- 2023/24 was 96%
- Analysis of Results (INTERPRET/ANALYZE): AY2023-2024 Results: Group average was 92.3%, about 4% lower than the prior year. In all cases, it is still notably higher than the 80% threshold for the class.
- Action Taken/Improvement Made (IMPROVE): AY2024-2025: Maintain current strategy. This course is currently active; the program will no longer be offered effective fall of 2025.
Valuable components have been migrated to other graduate offerings in the school of business. - Graph of Trends (CONTROL)
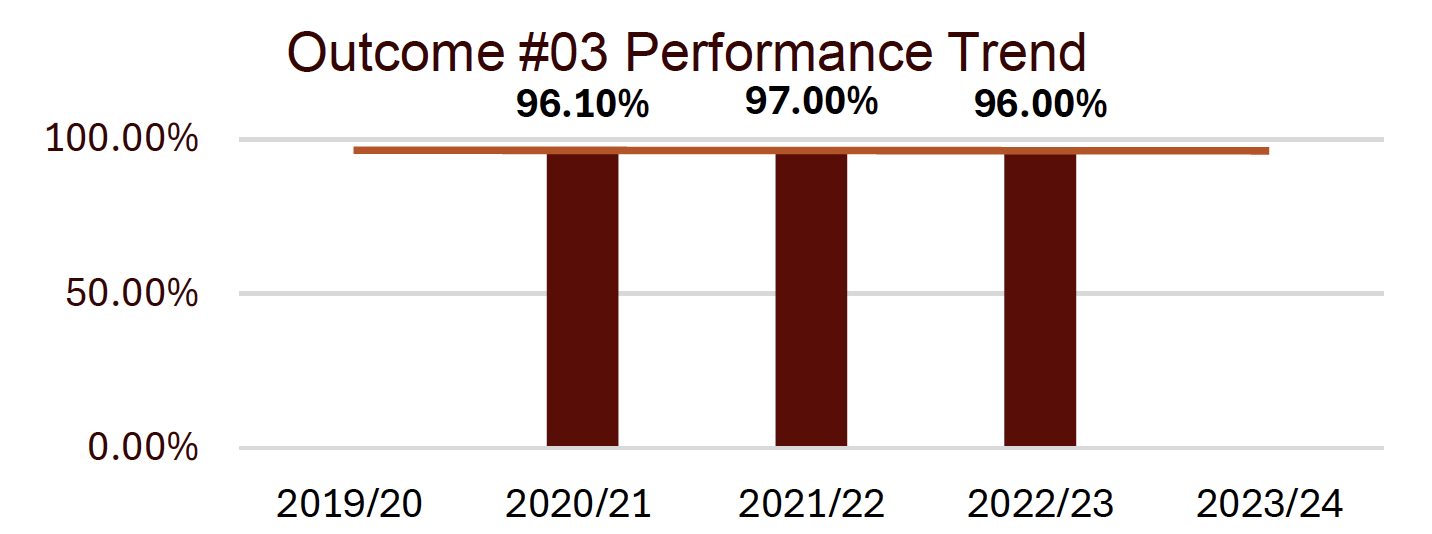
Outcome #3
- Approach (DEFINE): Graduates will manage and engage in complex systemic processing to help organization reach their full potential
- Deployment (MEASURE) - Direct, Formative, Internal: The goal of eighty percent (80%) or better of total points on the Final Ethics Project. SLD540
- Results (ANALYZE) - Activity Scores:
- 2019/20 No data
- 2020/21 was 96.1%
- 2021/22 was 97%
- 2022/23 was 96%
- 2023/24 No Data
- Analysis of Results (INTERPRET/ANALYZE): AY2023-2024 Results: No results available for this outcome.
- Action Taken/Improvement Made (IMPROVE): AY2024-2025: Maintain current strategy. This course is currently active; the program will no longer be offered effective fall of 2025.
Valuable components have been migrated to other graduate offerings in the school of business. - Graph of Trends (CONTROL)
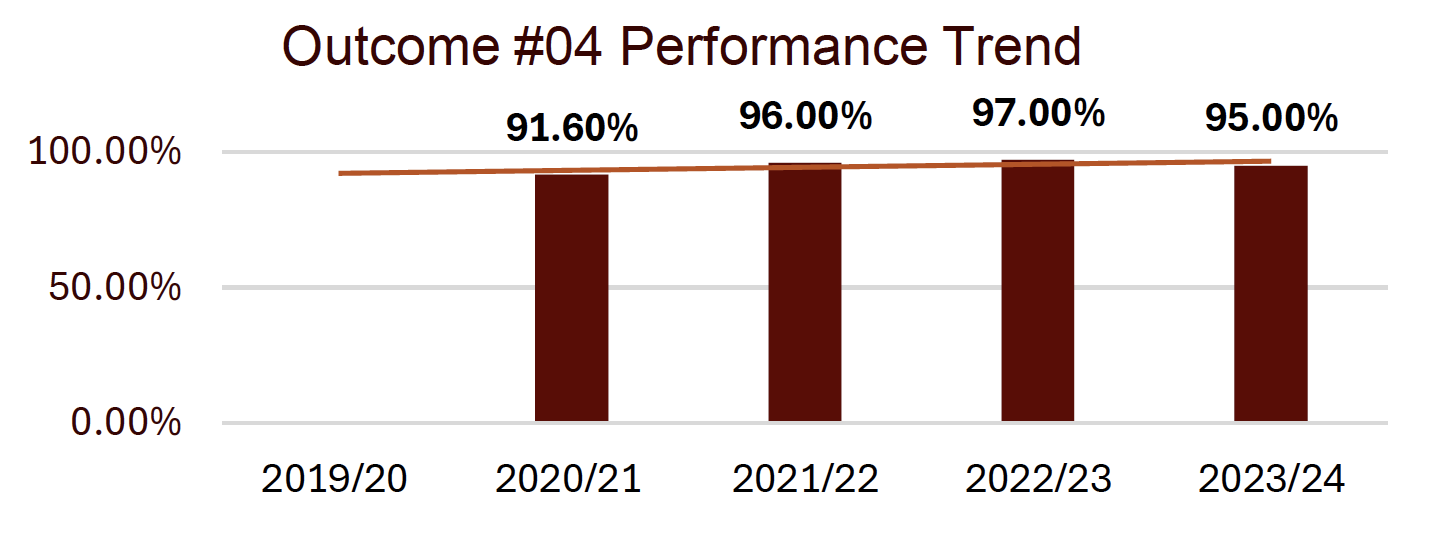
Outcome #4
- Approach (DEFINE): Graduates will demonstrate knowledge in building and sustaining effective organizational culture and ethical practices.
- Deployment (MEASURE) - Direct, Formative, Internal: The target average of 80% or better of total points on Design Project Paper. SLD545
- Results (ANALYZE) - Activity Scores:
- 2019/20 No data
- 2020/21 was 91%
- 2021/22 was 96%
- 2022/23 was 97%
- 2023/24 was 95%
- Analysis of Results (INTERPRET/ANALYZE): AY2023-2024 Results: The student average for all relevant work was 95%, ranging from 90.9% to 97%.
- Action Taken/Improvement Made (IMPROVE): AY2024-2025: Maintain current strategy. This course is currently active; the program will no longer be offered effective fall of 2025.
Valuable components have been migrated to other graduate offerings in the school of business. - Graph of Trends (CONTROL)
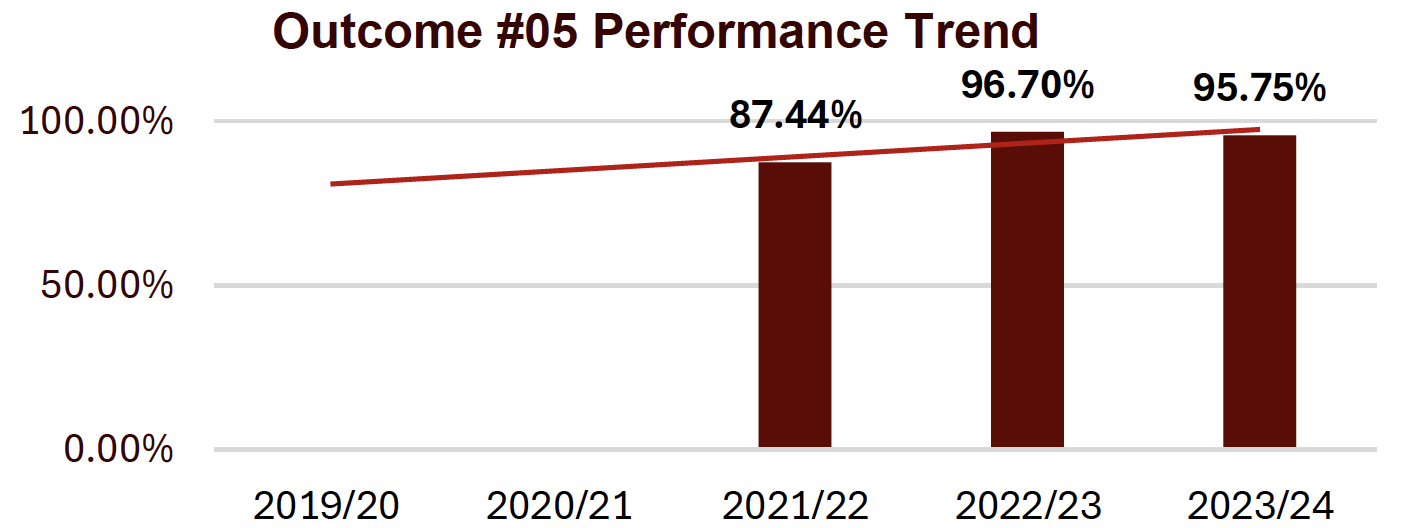
Outcome #5
- Approach (DEFINE): Graduates will demonstrate critical thinking, creativity, analytical, and ethical leadership skills to address and solve complex issue.
- Deployment (MEASURE) - Direct, Formative, Internal: The goal of eighty percent (80%) or better of total points on the Final Project (Analytical Business Report). SLD550
- Results (ANALYZE) - Activity Scores:
- 2019/20 No data
- 2020/21 was No Data
- 2021/22 was 87.44%
- 2022/23 was 96.7%
- 2023/24 was 95.75%
- Analysis of Results (INTERPRET/ANALYZE): AY2023-2024 Results: This course is currently active (May 30, 2024) and will conclude by mid August, 2024.
- Action Taken/Improvement Made (IMPROVE): AY2024-2025: Maintain current strategy. This course is currently active; the program will no longer be offered effective fall of 2025.
Valuable components have been migrated to other graduate offerings in the school of business. - Graph of Trends (CONTROL)